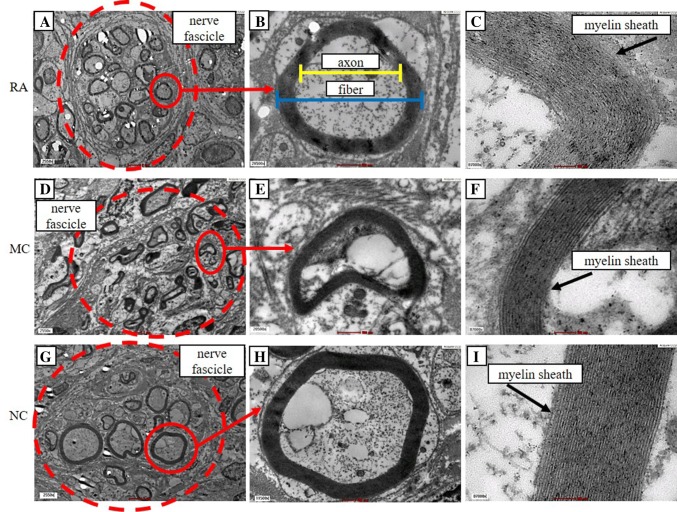
Fig. 7.
TEM analysis of the sciatic nerve. The dashed circles in A, D and G show axon in a nerve fascicle. Red arrows show an enlarged myelinated axon. The image in B shows a representative of axonal and fibre diameter. The images in C, F and I show layers of myelin that form myelin sheath. Analysis of the transverse section. A, D, G Magnification, 2550×. Scale bar, 2 μm. B, E, H Magnification, 20,500×. Scale bar, 500 nm. (C, F, I Magnification, 87,000×. Scale bar, 100 nm. n = 3

