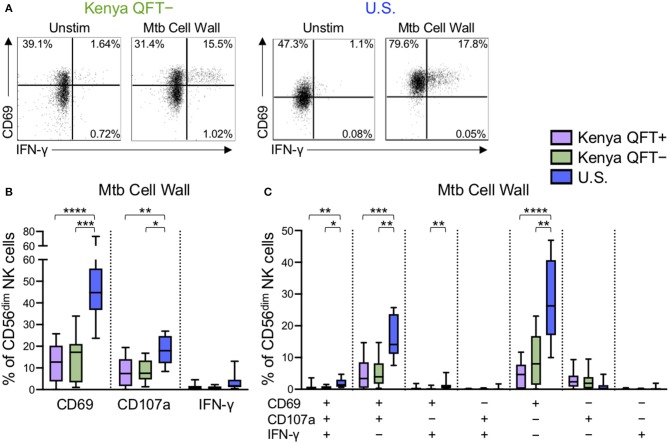
Figure 4.
Differential reactivity of CD56dim NK cells to Mtb antigen stimulation in Kenyan adults and U.S. healthy controls. PBMCs were stimulated with Mtb cell wall antigen for 24 h in the presence of 100 U/ml IL-2; PBMCs incubated with IL-2 alone, in the absence of Mtb antigen, served as a negative control (Unstim). (A) Representative flow plots of CD69 and IFNγ expression by CD56dim NK cells from a QFT− Kenyan donor and a U.S. healthy donor. (B) Expression of CD69, CD107a, and IFN-γ measured on CD56dim NK cells after stimulation with Mtb cell wall antigen. (C) Boolean analysis of co-expression patterns of CD69, CD107a, and IFN-γ expression by CD56dim NK cells after stimulation of PBMCs with Mtb cell wall. Data in (B,C) are shown from 51 Kenyan donors (n = 26 QFT+, n = 25 QFT−) and 9 U.S. healthy controls. Frequencies in (B,C) are shown after subtraction of background expression by CD56dim NK cells in the presence of media with IL-2 alone. Boxes in (B,C) represent the median and interquartile ranges; whiskers represent the 10th and 90th percentiles. Differences among groups were assessed using a Kruskal-Wallis test, with p-values adjusted for multiple comparisons using Dunn's post-test. *p < 0.05; **p < 0.01; ***p < 0.001; and ****p < 0.0001.

