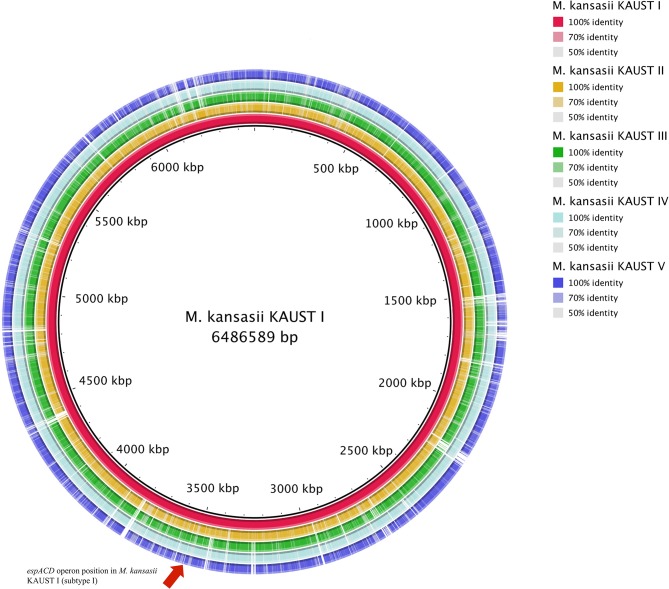
Figure 1.
Circular map representation of the M. kansasii subtype II–subtype V genome showing BlastN similarities to M. kansasii subtype I. Each ring of the circle corresponds to a specific complete genome as referred to in the figure keys on the right. The espACD operon position in M. kansasii KAUST I is indicated by an arrow.

