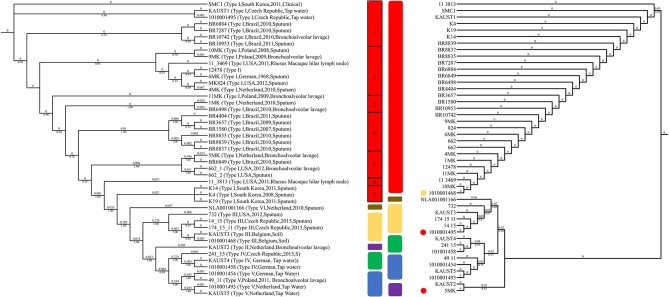
Figure 3.
Genotyping of M. kansasii using ITS and SNPs from the complete genome assemblies. The maximum-likelihood tree based on the internal transcribed spacer (ITS) sequences of 45 M. kansasii strains is shown on the right. The maximum-likelihood phylogenetic tree based on 135,969 SNPs from the core genome of M. kansasii subtypes is shown on the left. Bootstrap support values are indicated on the branch as a percentage of 100,000 replicates. The branch length is ignored for illustration purposes and displayed on each branch. The color code for each genotype: red: M. kansasii subtype I; purple: M. kansasii subtype II; yellow: M. kansasii subtype III; green: M. kansasii subtype IV; blue: M. kansasii subtype V; brown: M. kansasii subtype VI. The strains within M. kansasii subtype I are separated with black rectangles in the figure. The circles indicate the difference between the ITS and SNP genotyping method, and colors represent the genotypes suggested by ANI clustering.

