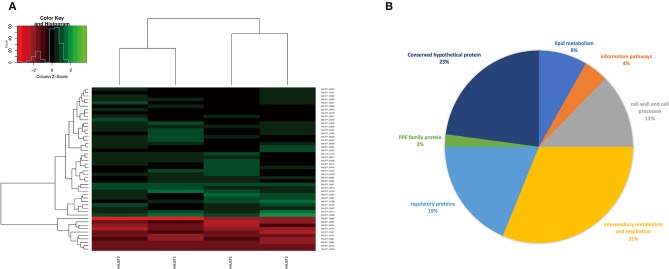
Figure 4.
(A) Gene expression profiles (log2 fold change) of the differentially expressed genes of M. kansasii subtypes II-V in comparison to M. kansasii subtype I. The red color represents upregulated genes, and the green color represents downregulated genes compared with the control strain. padj < 0.01 and Log2FC > 2 were used as the cutoff for the selection of the genes. (B) Pie-chart showing a subdivision of all differentially expressed genes based on functional categories.

