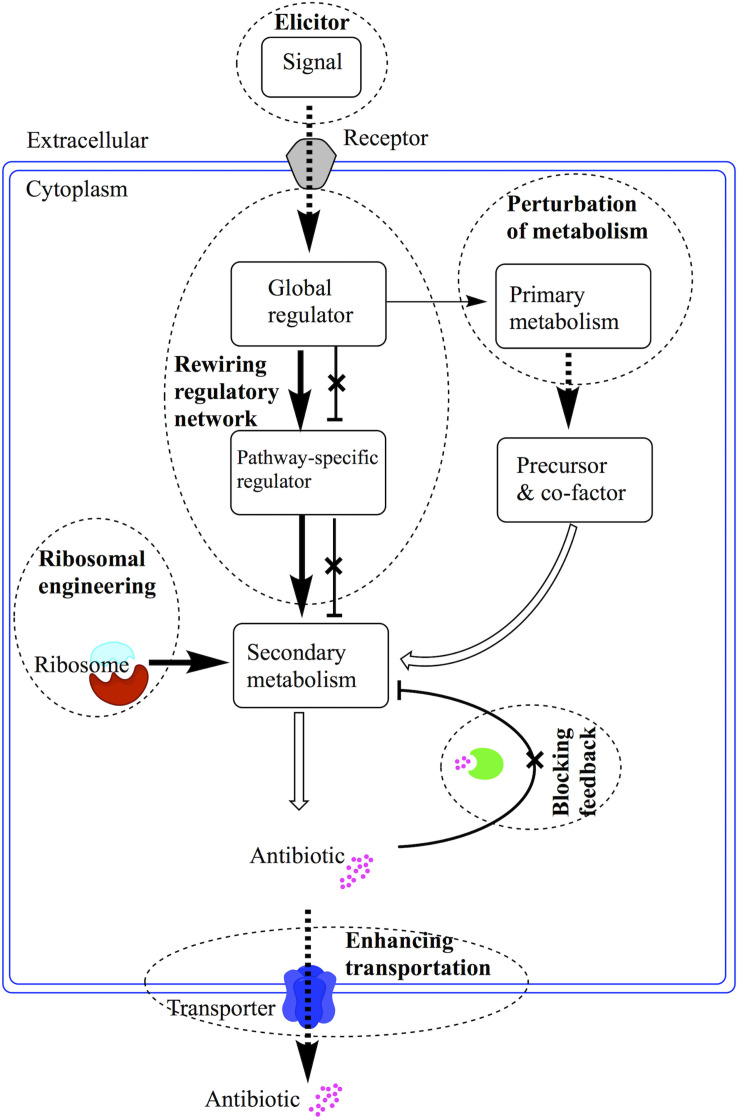
FIGURE 1.
Schematic diagram of application strategies for regulatory cascades in Streptomyces. The regulatory cascades are illustrated with arrow linked rectangles. The dash circles are annotated with bold text to describe the strategies employed to enhance antibiotic production or discovery of novel antibiotics. The bold arrows mean overexpression of positive regulators. The crossed perpendicular lines mean the deletion of repressors or inhibition of feedback reactions. The dash bold arrows mean enhanced supply of precursor or efflux of antibiotics.

