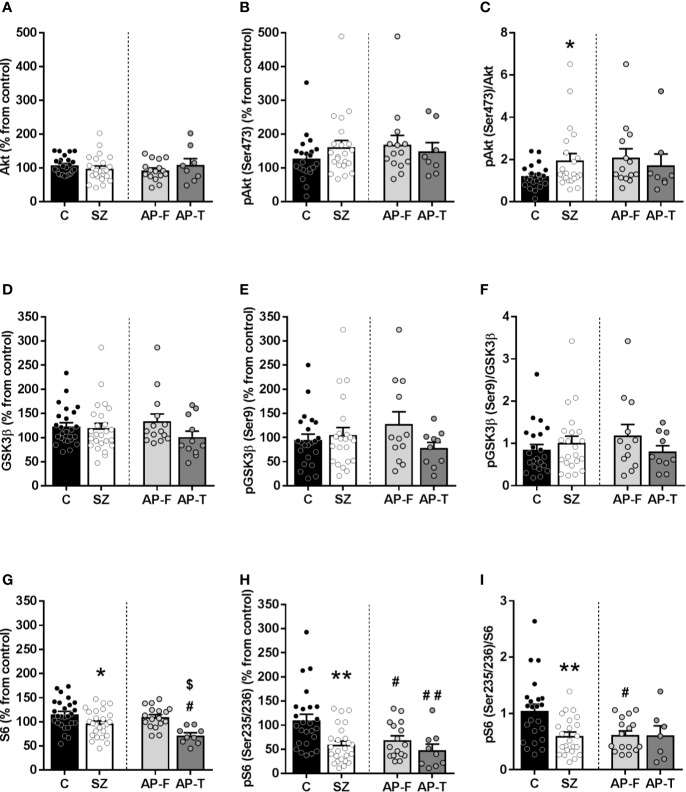
Figure 1.
Protein expression of signaling proteins in postmortem prefrontal cortex (PFC) from subjects with schizophrenia (SZ) [antipsychotic-treated (AP-T), or drug-free (AP-F)] and matched controls (C). Total Akt (A) and phospho-Akt(Ser473) protein levels (B). (C) Phospho-Akt(Ser473)/Akt ratio. Total GSK3β (D) and phospho-GSK3β(Ser9) protein levels (E). (F) Phospho-GSK3β(Ser9)/GSK3β ratio. Total S6 (G) and phospho-S6(Ser235/236) protein levels (H). (I) Phospho-S6(Ser235/236)/S6 ratio. *p < 0.05 and **p < 0.01 vs controls; unpaired Student's t test analysis. #p < 0.05 and ##p < 0.005 vs controls and $p < 0.05 vs AP-F; one-way analysis of variance (ANOVA) followed by Bonferroni post-hoc test. Data represent the means ± standard errors of the mean (SEM) referred as a percentage of the inter-assay normalization sample.

