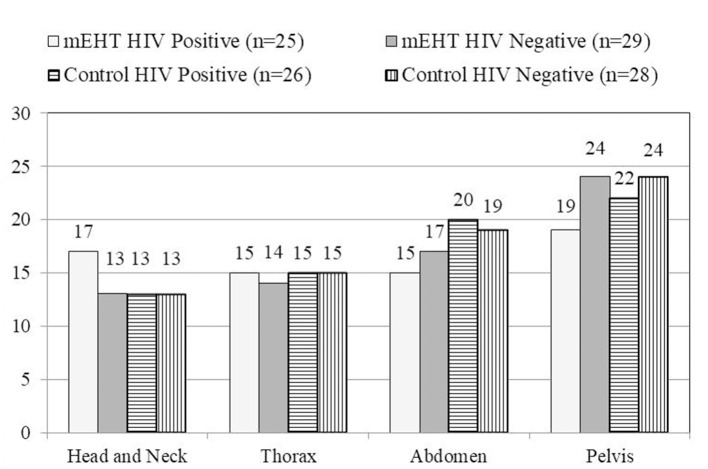
Figure 1.
Number of patients with nodes visualized by region. The number of participants with nodes visualized in each region is represented graphically, showing a similar pattern in all participants in each treatment group on the pretreatment 18F-FDG PET/CT. mEHT, Modulated Electro-Hyperthermia; HIV, Human Immunodeficiency Virus.

