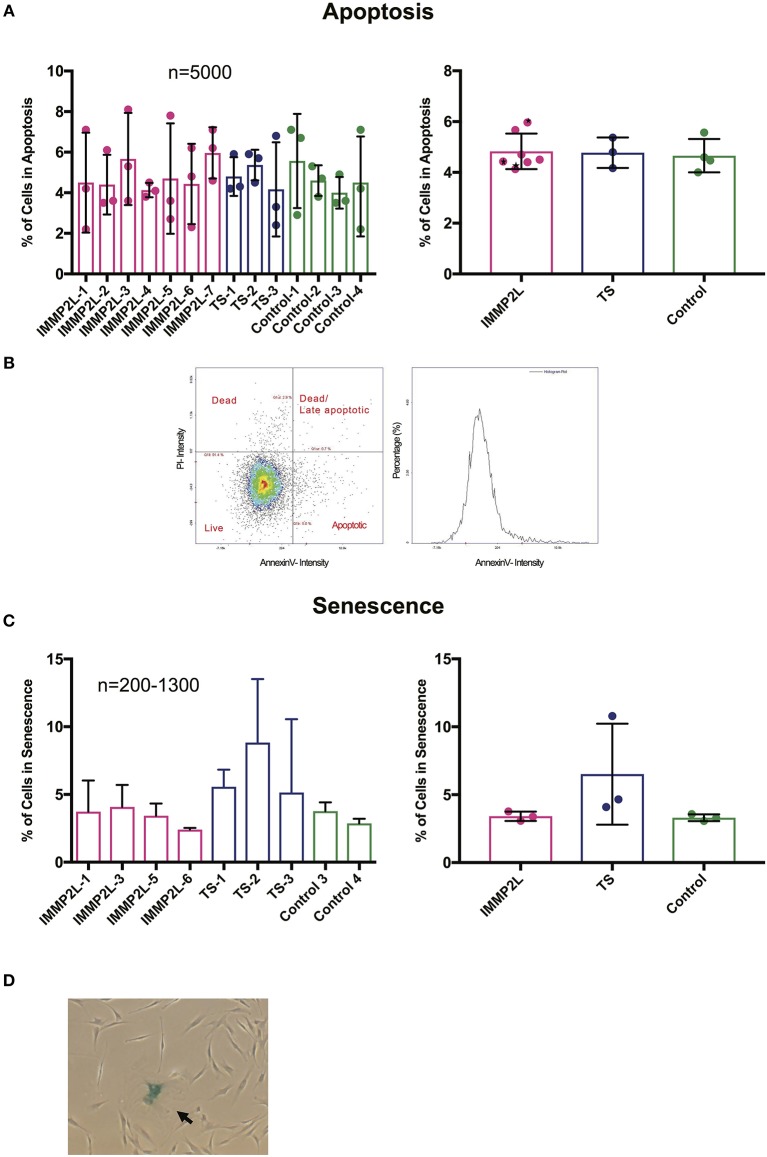
Figure 3.
Gilles de la Tourette syndrome (GTS) patients with and without IMMP2L deletions show no signs of increased apoptosis or senescence. (A) Mean percentage ± SD of apoptotic cells presented for each subject (left) and the three groups (right). (B) Representatives of dot plot and histogram for Annexin V and propidium iodine (PI) staining. As indicated on the dot plot, the cell population was divided into apoptotic, late apoptotic/dead, and dead. The apoptotic population was included in the charts. Black stars mark non-GTS individuals with IMMP2L deletions. (C) Mean percentage ± SD of senescent cells presented for each subject (left) and the three groups (right). (D) Representative image of a fibroblast culture with a senescent cell positive for β-Gal (arrow). For all charts, each bar represents three independent experiments. n indicates the number of cells analyzed per replica.

