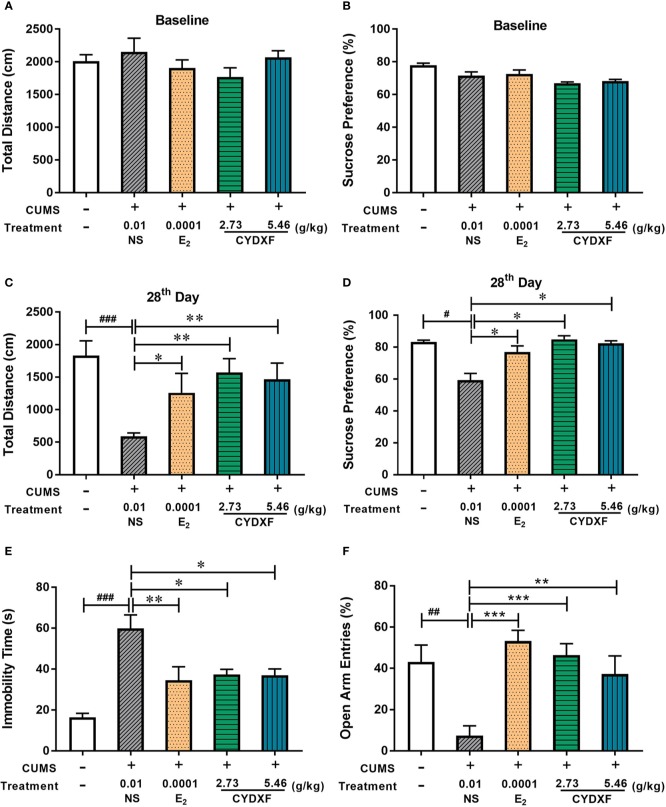
Figure 3.
Effect of CYDXF on behavioral tests. (A) OFT results on baseline; (B) SPT results on baseline; (C) The results of total traveled distance on day 28; (D) The results of sucrose preference on day 28; (E) Immobility time spent in FST; (F) Percentage of open arm entries in EPM. Results are presented as mean ± SEM (n=7). #P<0.05 vs control group; ##P<0.01 vs control group; ###P<0.001 vs control group; *P<0.05 vs CUMS group; **P<0.01 vs CUMS group; ***P<0.001 vs CUMS group.

