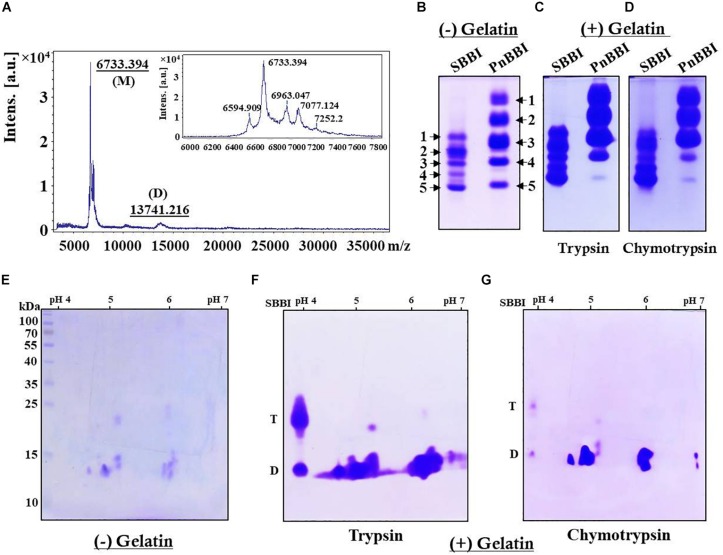
FIGURE 2.
Molecular mass determination and electrophoretic visualization of PnBBI isoinhibitors, and in-gel activity staining. (A) MALDI-TOF intact mass spectrum of PnBBI from 3000-37000 m/z representing a sharp and high-intensity peak (monomer) with a molecular mass of 6733.394 Da, and its self-associated dimer (13741.216 Da). Inset: zoomed spectrum at 6000-7800 m/z represents the peanut isoinhibitors; (B) Visualization of PnBBI isoinhibitors (20 μg) resolved on native gel electrophoresis (12.5%). In-gel activity staining against bovine (C) trypsin and (D) chymotrypsin resolved on gelatin Native-PAGE; (E) 2-D electrophoretic separation of PnBBI (70 μg) isoinhibitors (IEF, pH 4-7, 11 cm, L) under non-reducing conditions and respective in-gel activity staining against bovine (F) trypsin and (G) chymotrypsin. The second dimension was performed on SDS-PAGE (15%) under non-reducing conditions. Gels were stained with CBB R-250. Soybean BBI (SBBI) is loaded as a positive control in Native-PAGE as well as activity staining studies. D-dimer and T-tetramer. The mass spectrum and gel pictures shown here are the selective representatives of two or three biological replicates (data provided as Supplementary Data Sheet 3).

