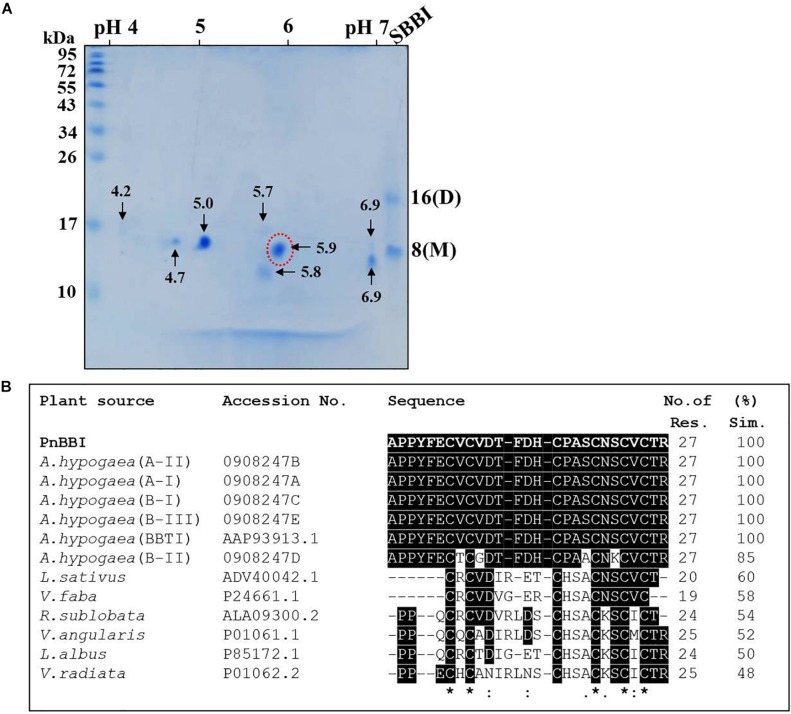
FIGURE 3.
2-D electrophoresis and MALDI TOF-TOF analysis of PnBBI. (A) Isoelectric focusing (pH 4-7, 11 cm, L) of PnBBI (70 μg) was performed under standard reducing conditions as described in methods (Section “Two-Dimensional Gel Electrophoresis (2-DE)”). The second dimension was performed on SDS-PAGE (15%) under reducing conditions and the gel was stained with CBB R-250. Molecular mass standards and soybean BBI were used as a reference and positive control, respectively. The 2-DE gel picture shown is the representative of three biological replicates; (B) The isoinhibitor spot with pI 5.9 (indicated by a dotted circle of Figure 3A) was subjected to trypsin digestion followed by MALDI TOF-TOF analysis. The resulting peptide sequence from Mascot MS/MS ions search was aligned with the homologous BBI sequences of NCBI database using Clustal Omega tool. The obtained sequence has shown 100% identity with peanut BBI. The gel picture shown here is the selective representation of three biological replicates (data provided as Supplementary Data Sheet 3).

