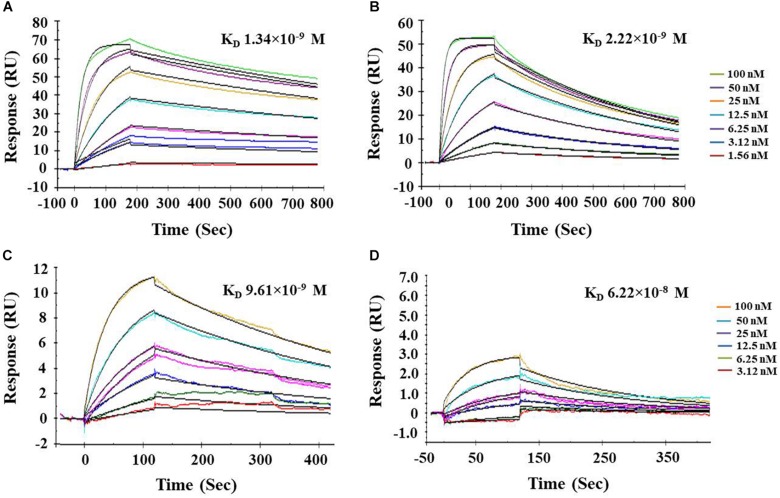
FIGURE 4.
Biacore surface plasmon resonance (SPR) analysis of PnBBI. Sensogram plots generated by SPR kinetic analysis demonstrate the association and dissociation characteristics between immobilized ligand (PnBBI) and analytes, bovine (A) trypsin and (B) chymotrypsin; Competitive binding studies between ligand and analytes where (C) Chymotrypsin (500 nM) was captured on PnBBI ligand and trypsin was passed through as an analyte and (D) Trypsin (500 nM) was captured on PnBBI ligand and chymotrypsin was passed over as an analyte. A range of trypsin/chymotrypsin concentrations (1.56, 3.12, 6.25, 12.5, 25, 50, and 100 nM) prepared in 10 mM HEPES, pH 7.4 are passed over the surface of PnBBI sequentially and the curves obtained were further analyzed by Langmuir fit model of 1:1 binding. One response unit (RU) corresponds to a change of 1 pg/mm2 in surface protein concentration i.e., analytes. The final sensorgram is representative of three cycles as described in Section“Surface Plasmon Resonance (SPR) and Competitive Binding Assay.”

