FIGURE 8.
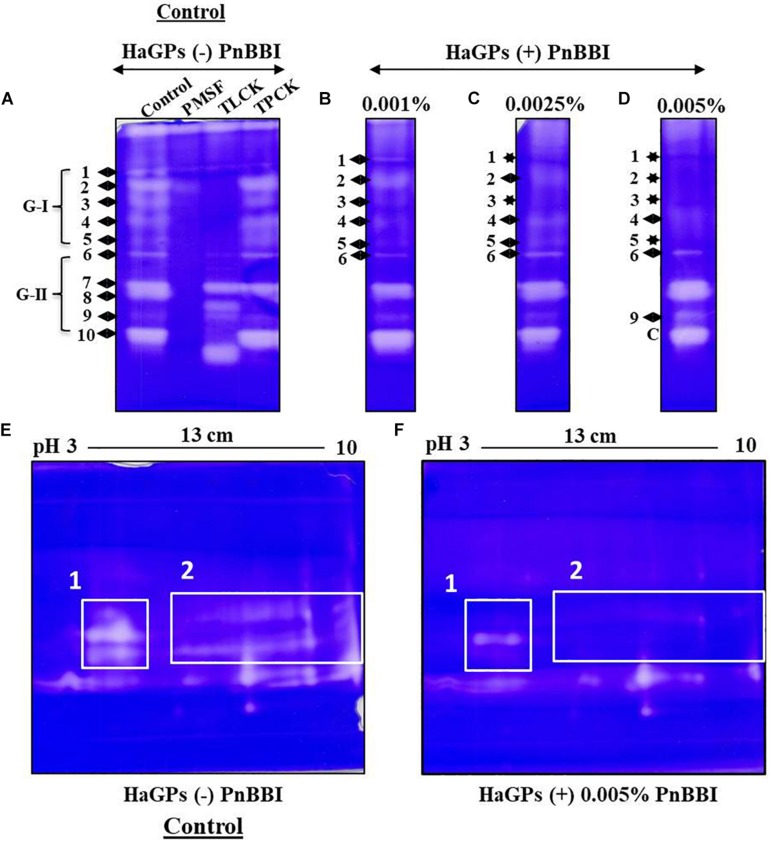
Comparative Zymography of HaGPs from larvae fed on PnBBI. Casein Native-PAGE zymogram of HaGPs extracted from larvae (day9) fed on diet with (A) No PnBBI (Lane1: HaGPs, lane2: HaGPs + PMSF, lane3: HaGPs + TLCK and lane4: HaGPs + TPCK); (B) 0.001% PnBBI; (C) 0.0025% PnBBI and (D) 0.005% PnBBI. Differential 2-DE zymography of HaGPs from larvae fed on (E) control diet and (F) 0.005% PnBBI supplemented diet. An equal amount of protein (8 μg) from both samples was subjected to rehydration of IPG strip under native condition followed by IEF, second dimensional SDS-PAGE (10%) and zymography as described in materials and methods (Section “Extraction of H. armigera Midgut Proteases (HaGPs) and Zymography”). The respective clear zones against the dark blue background are the result of casein digestion due to the presence of proteases. The area highlighted with boxes on 2-DE zymograms represents the disappearance of several proteases upon PnBBI ingestion as indicated against stars. The gel pictures are the selective representatives of two biological replicates (data provided as Supplementary Data Sheet 3).

