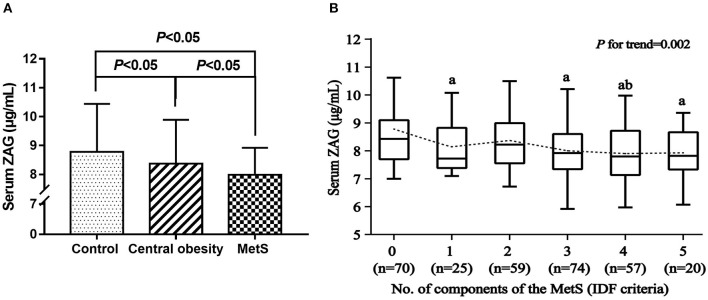
Figure 1.
(A) Serum ZAG levels in MetS, central obesity patients and controls. (B) Serum ZAG levels in relation to the number of MetS components. All values are expressed as the mean ± SD. MetS: metabolic syndrome; ZAG: zinc-α2-glycoprotein. aP < 0.05 compared with the MetS component number = 0; bP < 0.05 compared with the MetS component number = 2.

