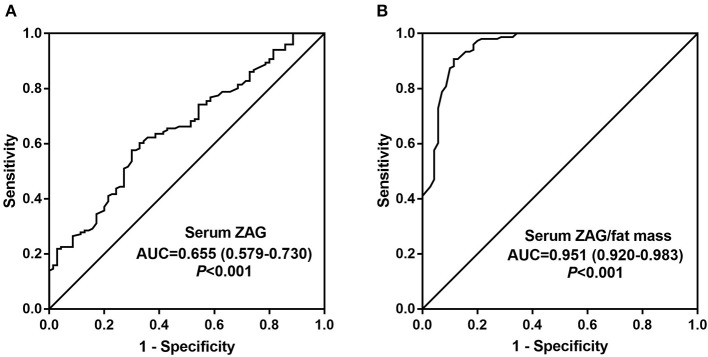
Figure 3.
Comparison for ROC curve analysis of serum ZAG (A) and serum ZAG/fat mass ratio (B) in MetS patients and controls. ROC curves were derived by plotting the relationship between the specificity and the sensitivity at various cut off levels. ZAG, zinc-α2-glycoprotein; ROC, receiver-operating characteristic; AUC, area under the curve.

