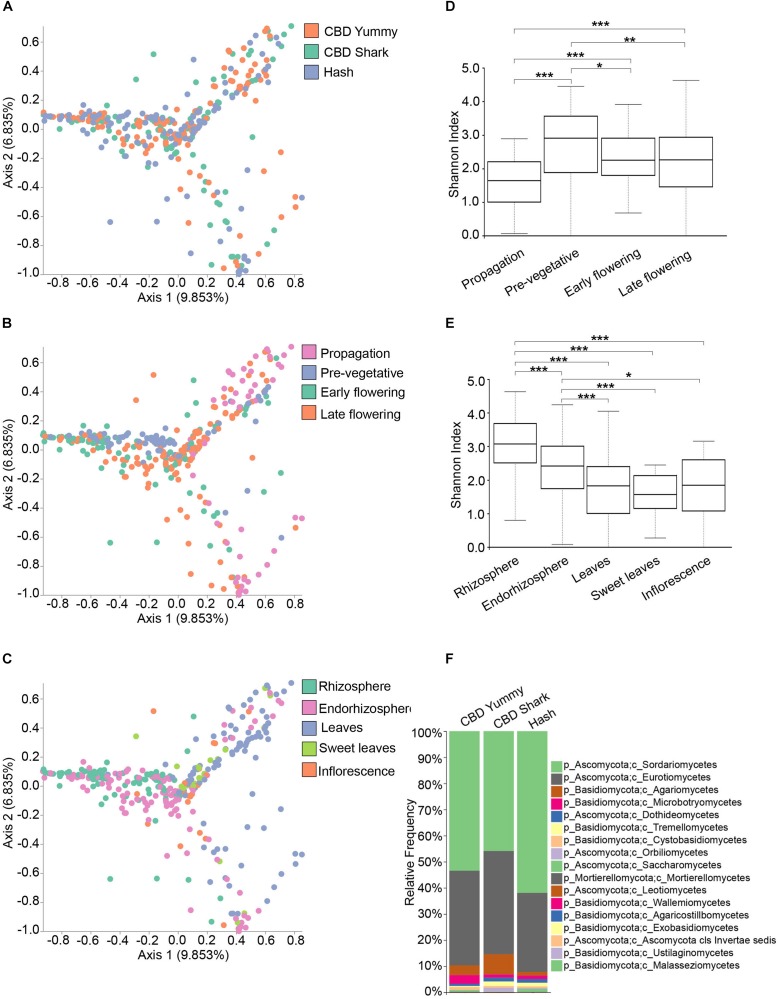
FIGURE 1.
Diversity metrics and taxonomical differences in the fungal microbiome of cannabis. (A). PCoA plot representative of inter-cultivar beta-diversity utilizing Bray–Curtis dissimilarity among samples (PERMANOVA: R2 = 0.013, p = 0.001). Each point represents a sample (CBD Yummy, n = 130; CBD Shark, n = 130; Hash, n = 130). (B). PCoA plot representative of temporal beta-diversity utilizing Bray–Curtis dissimilarity among samples (PERMANOVA: R2 = 0.080, p = 0.001). Each point represents a sample (Propagation, n = 60; Pre-vegetative, n = 90; Early flowering, n = 90; Late flowering, n = 150). (C). PCoA plot representative of spatial beta-diversity utilizing Bray–Curtis dissimilarity among samples (PERMANOVA: R2 = 0.091, p = 0.001). Each point represents a sample (Rhizosphere, n = 90; Endorhizosphere, n = 120; Leaves, n = 120; Sweet leaves, n = 30; Inflorescence, n = 30). For all PcoA plots, axis 1 and axis 2 represent the percentage of variance explained by each coordinate. (D,E) Alpha-diversity metric (Shannon’s index) of temporal and spatial variations amongst groups, respectively. Kruskal–Wallis pair-wise test was used to assess statistical significance between groups (***p < 10e-04,**p < 0.001,*p < 0.05; only statistically significant values are shown, non-significant groups are not represented). (F) Bar plot of the relative frequency of fungal taxa at the phylum and class level in the three chemotypes studied (CBD Yummy, n = 130; CBD Shark, n = 130; Hash, n = 130).

