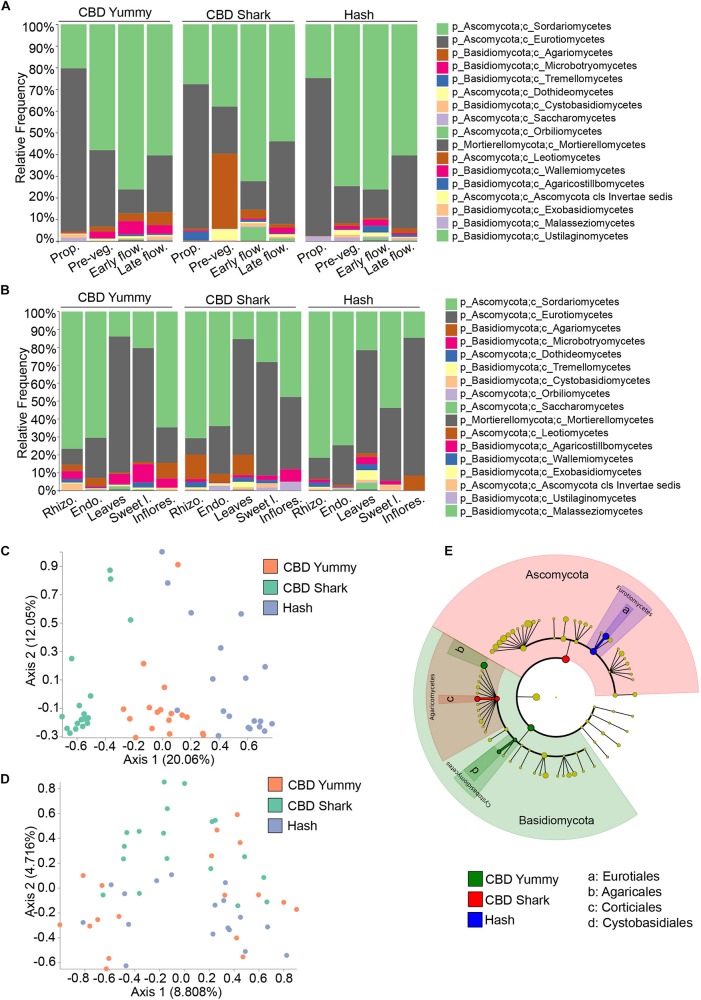
FIGURE 3.
Intra- and inter-cultivar differences in the fungal microbiome of cannabis along spatio-temporal lines. (A) Bar plot of the relative frequency of fungal taxa at the phylum and class level in the three chemotypes studied (CBD Yummy, n = 130; CBD Shark, n = 130; Hash, n = 130) at different growth stages (Prop = Propagation; Pre-veg = Pre-vegetative; Early flow = Early flowering; Late flow = Late flowering) and (B) for different plant parts (Rhizo = Rhizosphere; Endo = Endorhizosphere; Sweet l = Sweet leaves; Inflores = Inflorescence). Statistically significant differences in taxa between groups were measured using ANCOM. (C) PcoA plot representative of inter-cultivar beta-diversity utilizing Bray–Curtis dissimilarity (PERMANOVA: R2 = 0.22, p = 0.001) and (D) Jaccard similarity among samples (PERMANOVA: R2 = 0.058, p = 0.001). Each point represents a sample (CBD Yummy, n = 70; CBD Shark, n = 70; Hash, n = 70). (E) Taxonomic cladogram obtained from LEfSe analysis showing belowground fungal taxa that are differentially abundant between cultivars at the late flowering stage. Green represents an increased abundance in CBD Yummy, red an increased abundance in CBD Shark and blue an increased abundance in Hash chemotype.

