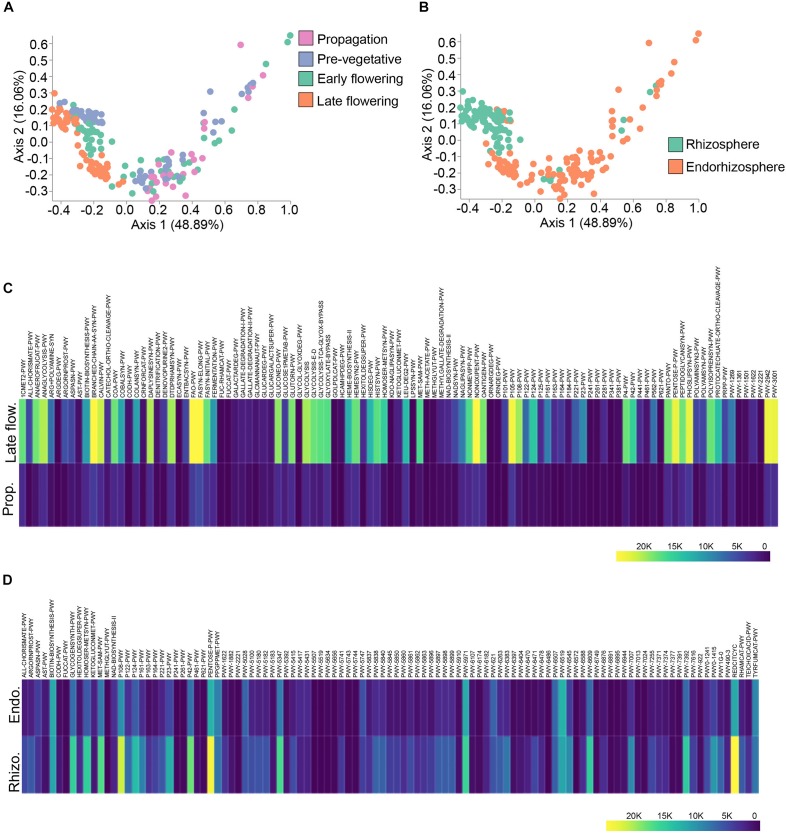
FIGURE 5.
Spatio-temporal variations in PICRUSt predicted pathways. (A) PcoA plot representative of temporal beta-diversity utilizing Bray–Curtis dissimilarity metric among samples (PERMANOVA: R2 = 0.24, p = 0.001). Each point represents a sample (Propagation, n = 30; Pre-vegetative, n = 60; Early flowering, n = 58; Late flowering, n = 60). (B) PcoA plot representative of spatial beta-diversity utilizing Bray–Curtis dissimilarity among samples (PERMANOVA: R2 = 0.20, p = 0.001). Each point represents a sample (Rhizosphere, n = 88; Endorhizosphere, n = 120). For all PcoA plots, axis 1 and axis 2 represent the percentage of variance explained by each coordinate. (C,D) Heatmap of differentially abundant pathways predicted by PICRUSt along temporal and spatial lines, respectively. Statistically significant differences between groups were measured using ANCOM. Prop = Propagation; Late flow = Late flowering; Rhizo = Rhizosphere; Endo = Endorhizosphere.

