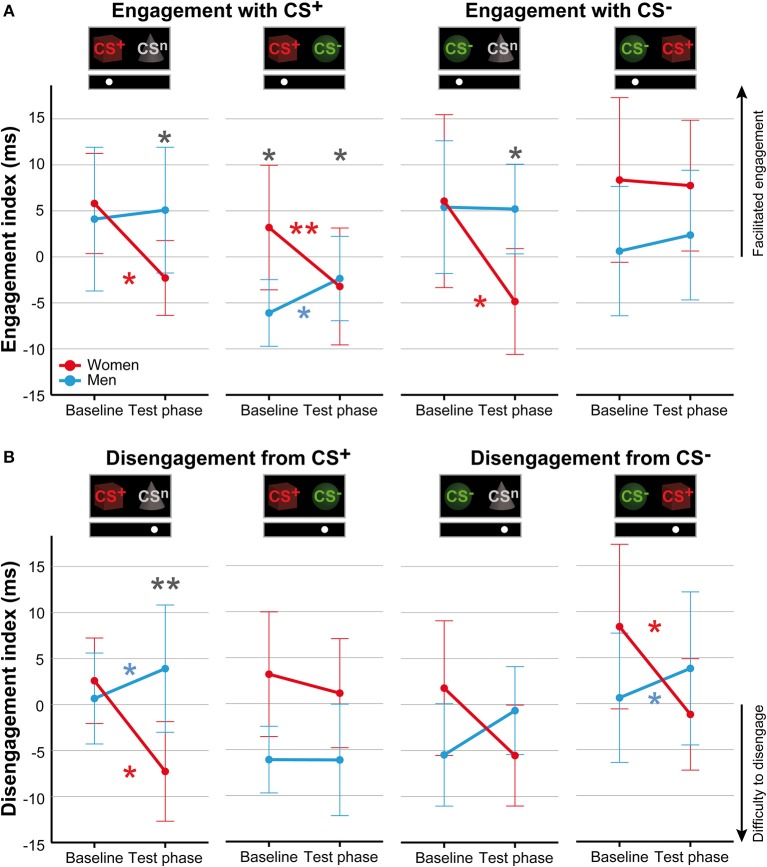
Figure 3.
Sex differences in attentional biases. Mean indices of attentional engagement (A) and disengagement (B) given in ms for women (red) and men (blue) for the dot-probe tasks accomplished at baseline and during the test phase. Please note that mean values depicted in the figure are not corrected for BMI that was used as covariate in statistical analyses. Significant differences between women and men are given with gray asterisks and within-group differences between baseline and test phase are given with the corresponding color code for women and men. Men compared to women showed higher attentional engagement with the CS+ and CS− when presented with the neutral cue and with the CS+ when presented together with the CS−. Women compared to men demonstrated stronger difficulties to disengage attention from the CS+ when presented with the neutral cue. **p < .010; *p < .050.

