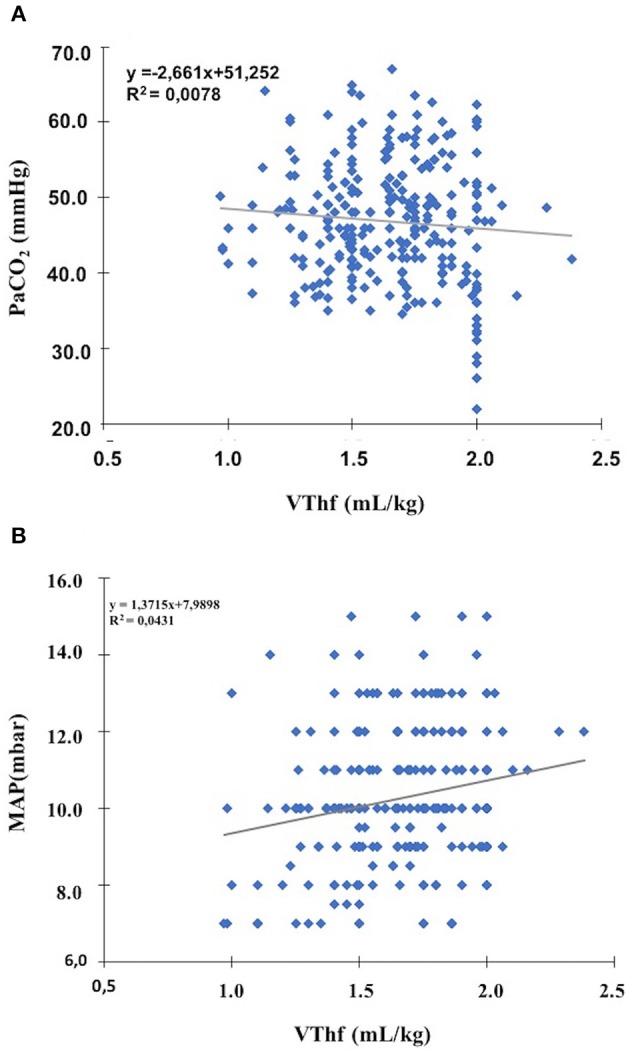
Figure 1.

Pearson correlation analysis between VThf, pCO2, and MAPhf levels (A) no significant correlation between all VThf and pCO2 levels (Pearson coefficient = 0.01, p = 0.899) (B) a very weak, but significant correlation between optimal VThf and MAPhf levels (Pearson coefficient = 317, p < 0.001).
