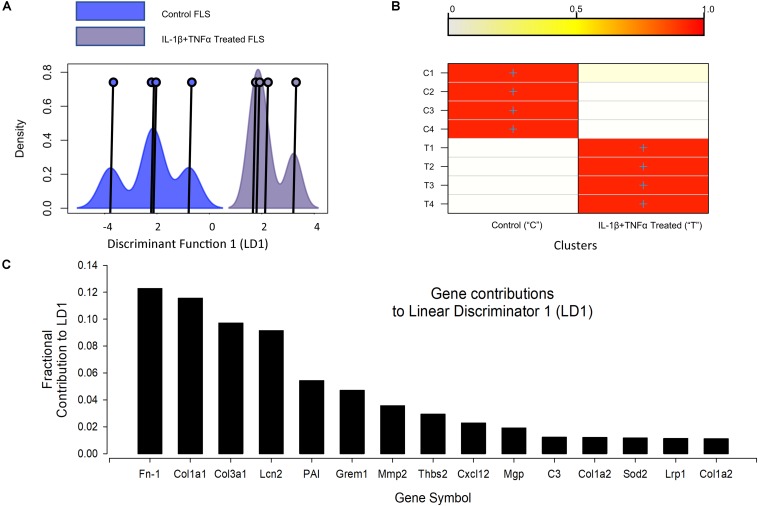
FIGURE 2.
Discriminant analyses of global IL-1β TNFα treatment effects. (A) Shows the kernel density plots of the discriminant component co-ordinates for the control and IL-1β/TNFα treatment groups; co-ordinates on the x-axis and density on the y-axis; Individual co-ordinate center points are illustrated by the vertical line and circle. There is clear separation between control and cytokine treated FLS samples. (B) A graphical confusion matrix showing the actual group membership (y-axis) and predicted cluster membership (on the y-axis). All groups are correctly clustered with greater than 0.9 probability. (C) The top 15 contributors to the linear discriminator function: Fn-1, fibronectin 1; Col1a1, collagen type I alpha 1 chain; Col3a1, collagen type III alpha 1 chain; Lcn2, lipocalin 2; PAI, serpine1; Grem1, gremlin 1; Mmp2, matrix metallopeptidase 2; Thbs2, thrombospondin 2; Cxcl12, C-X-C motif chemokine ligand 12; Mgp, matrix Gla protein; C3, complement C3; Col1a2, collagen type I alpha 2 chain; Sod2, superoxide dismutase 2; Lrp1, LDL receptor related protein 1; Col1a2, collagen type I alpha 2.

