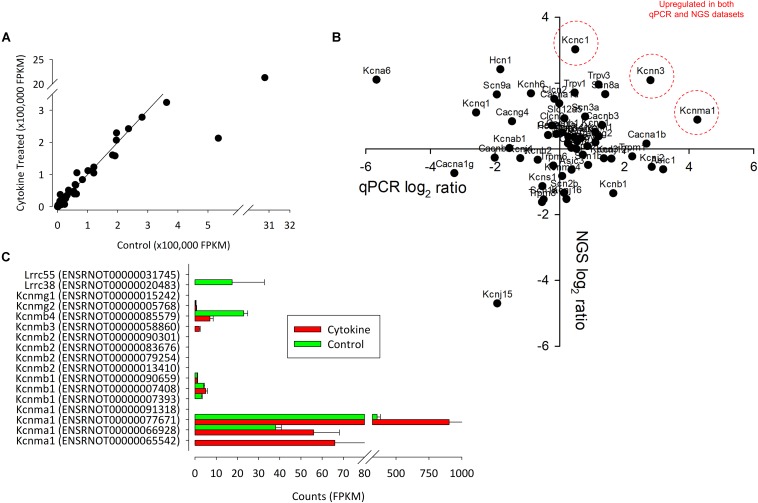
FIGURE 4.
The correlation between control and NGS expression data. (A) We found a strong correlation between control and treated (72 h of IL1β + TNFα) channel expression data. Each point represents the intersection of four control and four test values. In (B), the correlation between qPCR (ΔΔCts) and NGS ratio (FPKM values) are shown. Data suggest that there only a weak linear correlation between qPCR and NGS. P-value = 0.3. R = 0.29. n = 14 (eight animals for NGS and six animals for PCR). Genes that were upregulated in both datasets are indicated in red. (C) Summary of NGS expression of all known (rat) splice variants of Kcnma1 and associated Kcnmb subunits.

