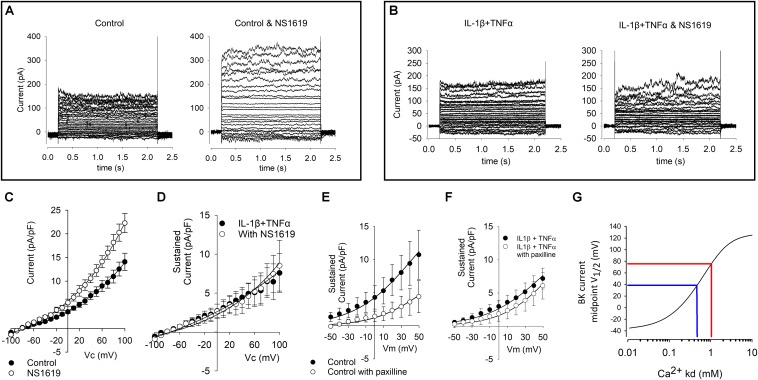
FIGURE 6.
Effects of BK channel drugs on FLS whole-cell currents. (A) Representative examples of untreated (control) cells before (left) and in the presence of 1 μM of the BK channel opener NS1619 (left). Voltage protocols as shown in Figure 5. (B) Representative raw example current families of cytokine (10 ng/ml IL1β + TNFα) treated cells in the absence (left) and presence (right) of 1 μM NS1619. (C) Current–voltage curves from a number of control FLS cells such as that shown in (A). Current is significantly greater in the presence of NS1619, p < 0.05, n = 9 and 6. (D) Current–voltage curves for a number of treated FLS cells such as that shown in (B). These two curves are not significantly different from each other n = 6 and 6. (E) Current–voltage curves from a number of control FLS cells treated with and without paxilline; there is a significant decrease in paxilline current p < 0.05 n = 13,5), but (F) there was no significant different of current density in the presence of the BK inhibitor paxilline following cytokine treatment (n = 6, 12). (G) Numerical simulation of data from Clark et al. (2017) model. To quantify the degree of change of BK channel modulation apparently taking place with this treatment we used the model of verbatim with the exception that we varied the inherent BK channel Ca2+ sensitivity parameter Kd. In this simulation, the independent variable Kd is plotted on the x-axis and the predicted BK current midpoint (V1/2) is plotted on the y-axis. In blue, we have added hypothetical midpoints of 40 mV and 80 mV representing a hypothetical shift in 40 mV by cytokine treatment. The complete MATLAB code for this simulation is included in the Supplementary File S1.

