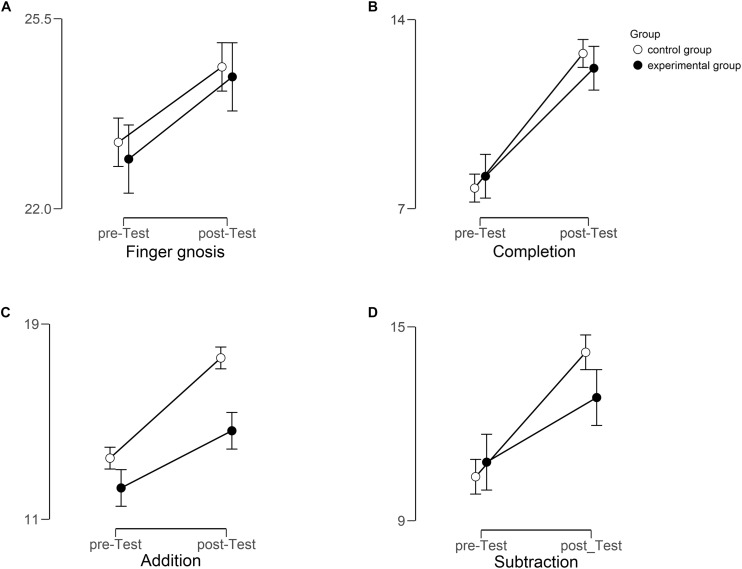
FIGURE 1.
Mean scores for all dependent variables [(A) Finger gnosis, (B) Completion, (C) Addition, and (D) Subtraction] for each group (experimental group [black] versus control group [white]) and each time (pre- versus post-test). Error bars indicate standard errors. Note, that the figure for subtraction displays results of the reduced sample (N = 63, for more details refer to the text).

