
Figure 2.
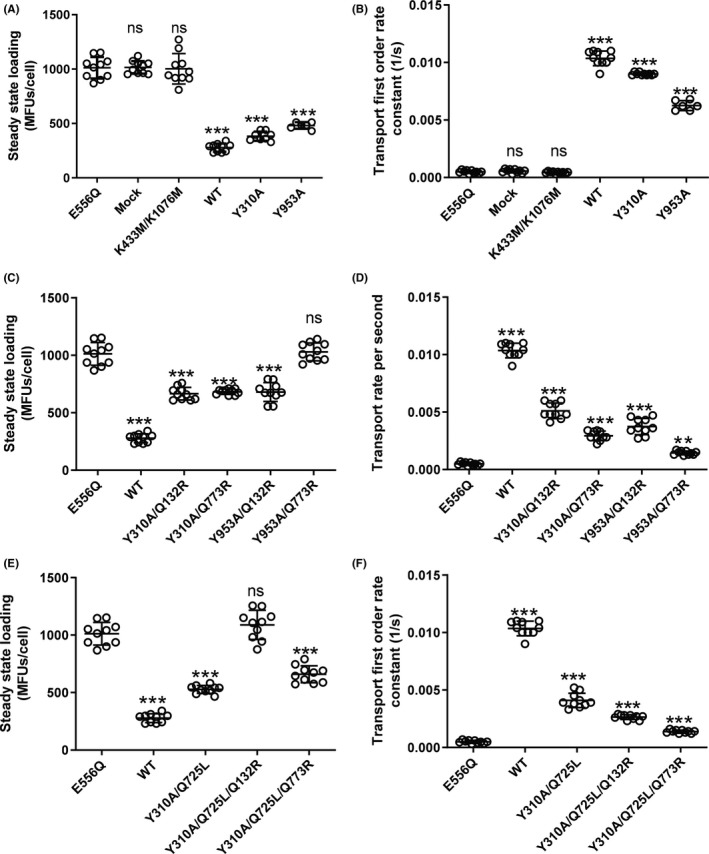
Steady‐state loading levels (A,C,E) and transport rates (B,D,F) in wild‐type P‐gp, mutants and negative controls. Data of 10 independent experiments are shown. Mutants are grouped in the following way: (A and B) Tyrosine mutants Y310A and Y953A in comparison with wild‐type (positive control) and the catalytic glutamate mutant E556Q, mock‐transfected cells and the Walker A lysine double mutant K433M/K1076M (negative controls). (C and D) Tyrosine mutants Y310A and Y953A introduced in the background of the binding‐mode selector mutants Q132R and Q773R. (E and F) Double mutant Y310A/Q725L in comparison with triple mutants Y310A/Q725L/Q132R and Y310A/Q725L/Q773R. Wild‐type and the catalytic glutamate mutant E556Q are shown for comparison. The central horizontal bar corresponds to the mean. Error bars refer to standard deviation. Statistical significance was determined by one‐way ANOVA using the Bonferroni multiple comparison post‐hoc test. Statistical significance levels are indicated by asterisks (***P < .001). ns, not statistically significant