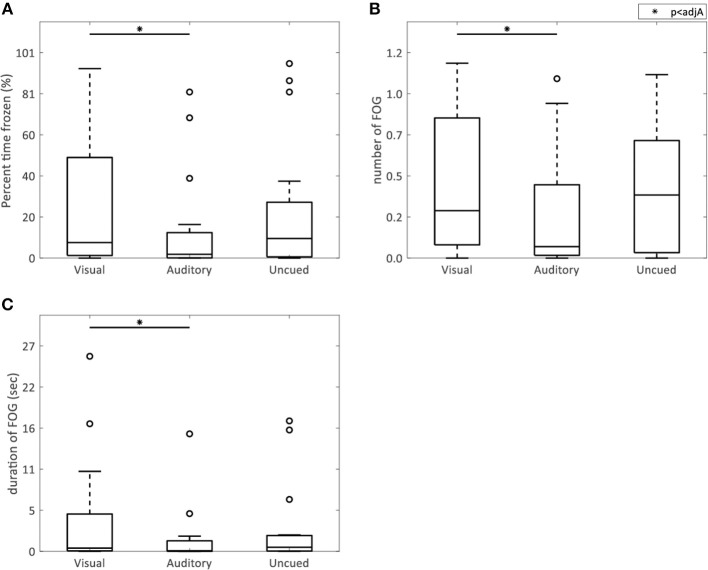
Figure 2.
AR visual cues vs. control conditions in FOG parameters. Boxplots showing the percent time spent frozen (A), and the mean number (B), and duration (C) of FOG episodes in the conditions with AR visual cues (“Visual”), a metronome (“Auditory”), and no cues (“Uncued”). Significant pairwise comparisons are indicated by horizontal bars with asterisks.

