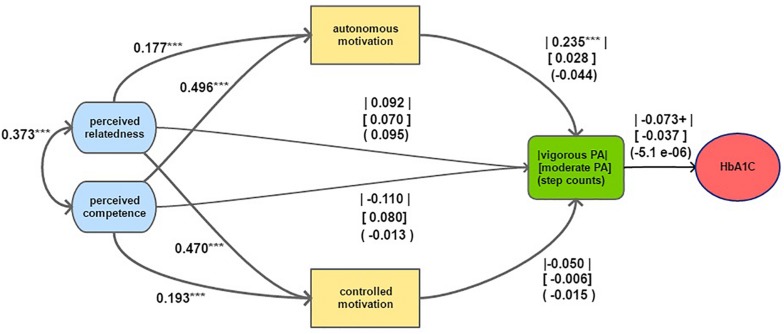
FIGURE 2.
Structural model of motivational constructs predicting physical activity combined with the linear model predicting HBA1C. Note: The models control for covariates as reported in the “Materials and Methods” section. Parameter estimates are fully standardized. Parameters between straight lines, parentheses and square brackets refer to the estimates with regards to vigorous PA frequency, moderate PA frequency and pedometer counts, respectively. HbA1C was predicted in percentage points. P-value codes: < 0.1 ‘ + ’, p < 0.05 ‘*’, p < 0.1 ‘**’, p < 0.005 ‘***’.

