Figure 1.
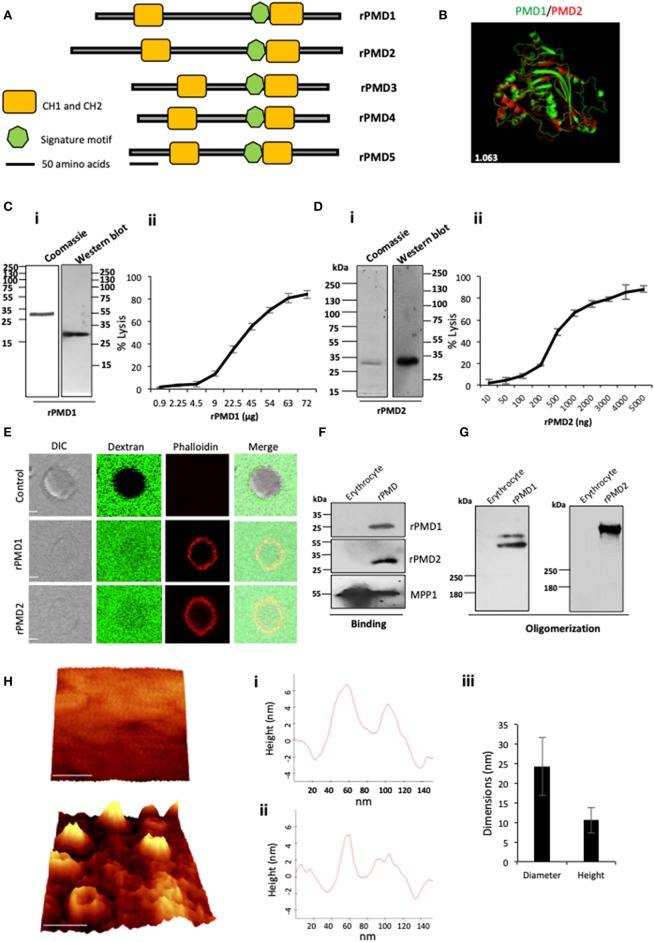
Purification and activity of rPMDs. (A) Domain architecture of the MACPF domain of PfPLPs. The signature motif (green box) and two transmembrane helical domains, CH1 and CH2 (yellow boxes) are depicted. Scale bar represents 50 aa. (B) Structural superimposition of PMD domain of PfPLP1 and PfPLP2. RMSD value is indicated in white. (C) (i) Coomassie and Western blot of affinity-purified rPMD1 probed with the anti-his antibody. (ii) The dose-dependent membranolytic activity of rPMD1. The lysis of human erythrocytes was analyzed in the presence of different concentrations of rPMD1. The graph indicates the percent lysis of human erythrocytes by rPMD1 as compared with 100% hypotonic lysis of human erythrocytes in water (n = 3). (D) (i) Coomassie and Western blot of affinity-purified rPMD2 probed with the anti-his antibody. (ii) The dose-dependent membranolytic activity of rPMD2. The lysis of human erythrocytes was analyzed in the presence of a different amount of rPMD2. The graph indicates the percent lysis of human erythrocytes by rPMD2 as compared with 100% hypotonic lysis of human erythrocytes in water (n = 3). (E) Permeabilization activity of rPMD1 and rPMD2. The human erythrocytes were incubated with Phalloidin Alexa 594 and 10 kDa FITC-Dextran in the presence and absence of rPMD1 and rPMD2 and visualized under a confocal microscope. Phalloidin staining was detected in the human erythrocytes treated with rPMD1 and rPMD2 but not in untreated human erythrocytes. (F) Western blot analysis of bound rPMD1 and rPMD2 eluted by 1.5 M NaCl. (G) Oligomerization of rPMD1 and rPMD2. rPMDs are incubated with human erythrocytes at 37°C for 30 min and analyzed for oligomeric rPMD1 and rPMD2 by Western blotting. (H) Visualization of oligomeric pores by AFM. (i) Erythrocytes were treated without (top) or with rPMD2 (bottom) for 30 min at 37°C and visualized under the AFM for pore formation. The image was 3D constructed using project Witec 4.1 software (n = 2). Scale bar represents 50 nm. (ii) Line profile of rPMD2 oligomers. Representative images of the height of the oligomer measured along the pore in AFM topographs are depicted. (iii) The average ring diameter and height of rPMD2 treated oligomers protruding from the erythrocytes membrane. Diameter and height were measured for oligomers formed on the erythrocyte membrane. Bars represent an average of 30 oligomers and error bars SD.

