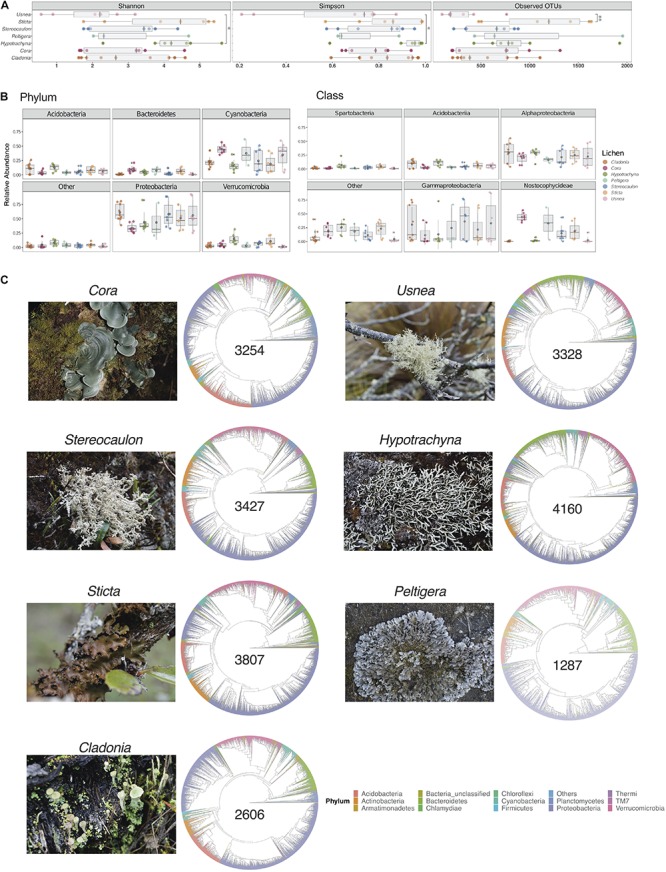
FIGURE 1.

Microbial diversity varies across seven lichen genera. (A) Diversity and richness values for samples per lichen genus, measured by the Shannon and Simpson indices and the number of Observed OTUs, respectively. Multiple comparisons of richness and diversity measures were performed by one-way ANOVA with P values of <0.05 considered to be statistically significant. Asterisks indicate significant differences between Usnea and Hypotrachyna for Simpson (p = 0.037) and Shannon (p = 0.026) indices, and between Usnea and Sticta (p = 0.01) for Observed of OTUs. (B) Relative abundance of the five most abundant phyla and classes. Data are presented as mean ± standard deviation (SD). (C) Taxonomic diversity of lichens with the total number of OTUs for a given genus (shown in the center of cladogram).
