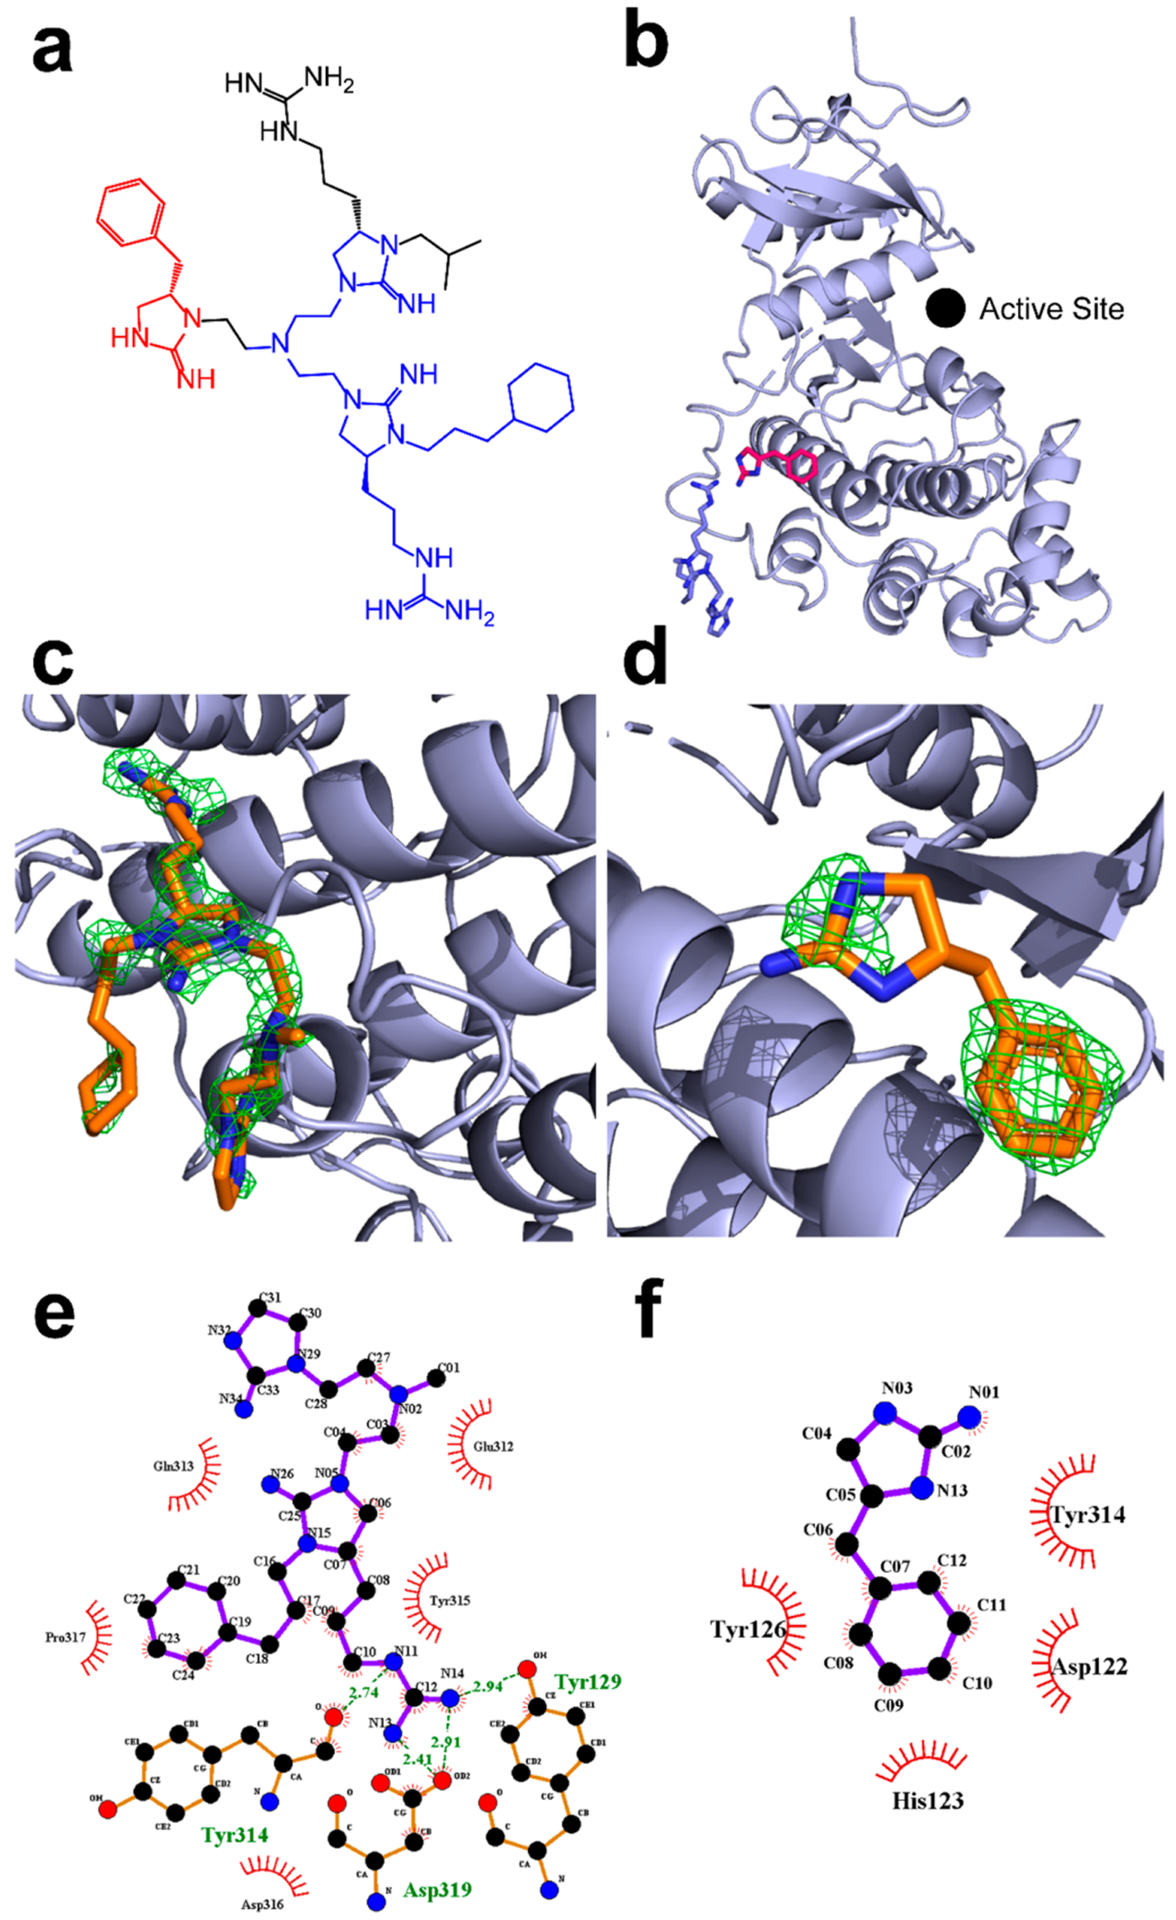
Figure 5.

1.9 Å resolution structure of ERK2 in complex with inhibitor 2507–8. (a) Chemical structure of inhibitor 2507–8. (b) Structure of ERK2 (light blue) in complex with inhibitor 2507–8, in which the latter was resolved as two fragments termed A and B, which are colored blue and red, respectively, corresponding to the colored atoms in panel a. The Fo – Fc composite omit map contoured at 3.0σ and calculated in Phenix after the removal of ligands is shown for (c) fragment A and (d) fragment B. LigPlot projections of hydrophobic and ionic interactions are shown for (e) fragment A and (f) fragment B. Ionic interactions are shown using green dashed lines. Hydrophobic interactions are shown using circular red bursts.
