Table 1.
Top Scaffold Samples That Exhibited the Greatest Displacement of the Fluorescent Probe during Scaffold Screeninga
| Scaffold Sample # | Structure | Percent (%) signal change |
|---|---|---|
| 2408 | 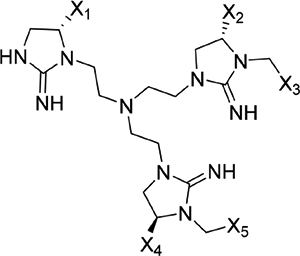 |
55.7 |
| 2407 | 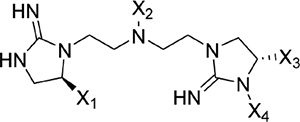 |
21.2 |
| 2353 | 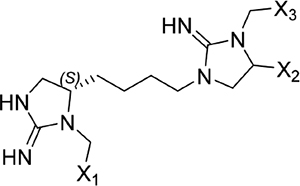 |
19.5 |
| 2157 | 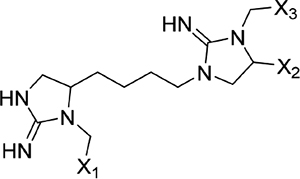 |
19.4 |
| 2354 | 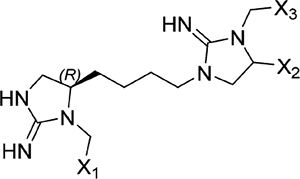 |
16.3 |
Screening results for the mixture-based scaffold ranking library at concentrations of 25 μg mL−1. Scaffold samples were ranked by their average percent change in anisotropy signal relative to controls (free probe in solution = 100%; probe maximally bound to ERK2 = 0%), indicating displacement of the FITC-X-Lig-D probe from the DRS of ERK2. Data reported as the average of two replicate samples at a mixture dose of 25 μg mL−1. Variable functional groups (X1–5) on each scaffold structure indicate that mixtures of different moieties are present.
