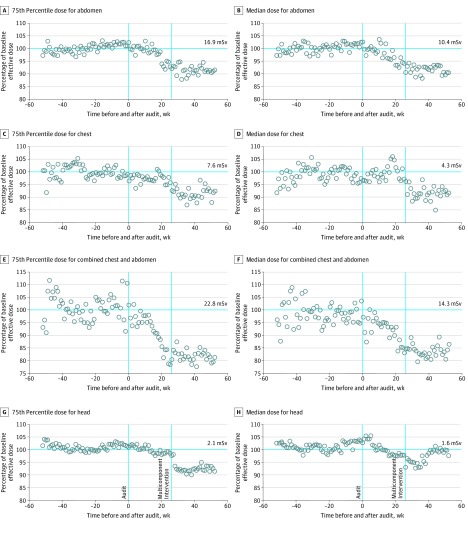
Figure 2. Effective Dose Compared With Preaudit Baseline.
Effective dose by week before or after the audit, shown as the percentage of the 75th percentile or median dose at pre-audit baseline dose. Numbers on the horizontal cyan lines in A, C, E, and G represent the 75th percentile in dose at baseline and in B, D, F, and H represent the 50th percentile in dose at baseline. Each circle reflects the 75th percentile dose (A, C, E, G) or the median dose (B, D, F, H) relative to the pre-audit baseline values across all imaging facilities. Doses equal to the baseline dose are 100%. Values less than 100% indicate the relative decrease in dose.

