
Fig. 3.
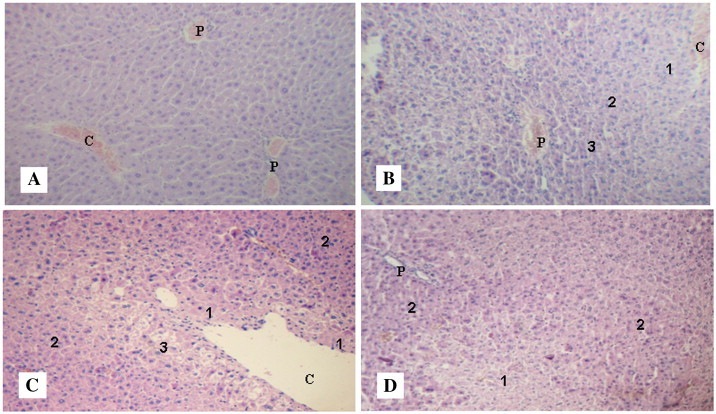
Representative micrographs of hematoxylin-eosin stained liver sections. Magnification: 10×. See the procedures in Materials and methods. (A) Control mice (no treatment). C: central vein; P: portal area. (B) Mice from the group “CCl4 alone”. Centrilobular degeneration (1); mid-zonal degeneration (2); perilobular swelling (3); C: central vein; P: portal area. (C) Mice from the group “MHV alone”. Necrosis (1); cellular swelling (2); hydropic degeneration (3); C: central vein. (D) Mice from the group “MHV + CCl4”. Necrosis (1); cellular swelling (2); P: portal area.