
Fig. 4.
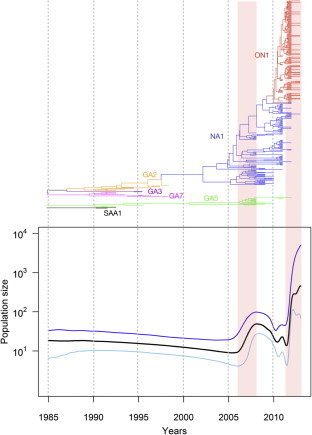
Genealogies and the corresponding Bayesian skyline plot showing the demographic history of HRSV sequences, which are drawn using the same time scale. The y-axes of the skyline plot (lower panel) represent the population size, which is equal to the product of the effective population size (shown as the product of Ne and generation time τ). The black line represents the median estimate and the areas between the blue and sky lines show the 95% highest posterior density limits. The Maximum clade credibility (MCC) tree (upper panel) is represented on the same time scale as the skyline plot. (For interpretation of the references to color in this figure legend, the reader is referred to the web version of this article.)