
Fig. 1.
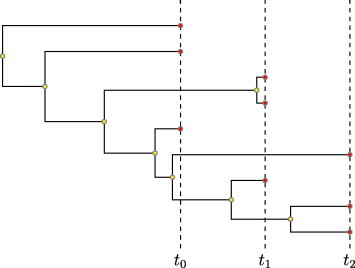
A serially sampled time tree of a rapidly evolving virus, showing that the sampling time interval [t0,t2] represents a substantial fraction of the time back to the common ancestor. Red circles represent sampled viruses (three viruses sampled at each of three times) and yellow circles represent hypothetical common ancestors. (For interpretation of the references to colour in this figure legend, the reader is referred to the web version of this article.)