
Fig. 4.
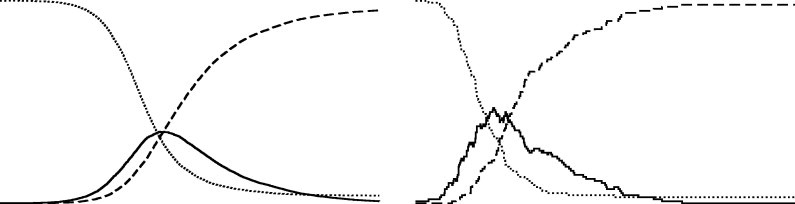
Realization of an SIR model showing the dynamics of susceptible (dotted line), infected (solid line) and recovered (dashed line) individuals over time. The stochastic version leads to less “smooth” dynamics (right hand side).
Official websites use .gov
A
.gov website belongs to an official
government organization in the United States.
Secure .gov websites use HTTPS
A lock (
) or https:// means you've safely
connected to the .gov website. Share sensitive
information only on official, secure websites.
Realization of an SIR model showing the dynamics of susceptible (dotted line), infected (solid line) and recovered (dashed line) individuals over time. The stochastic version leads to less “smooth” dynamics (right hand side).