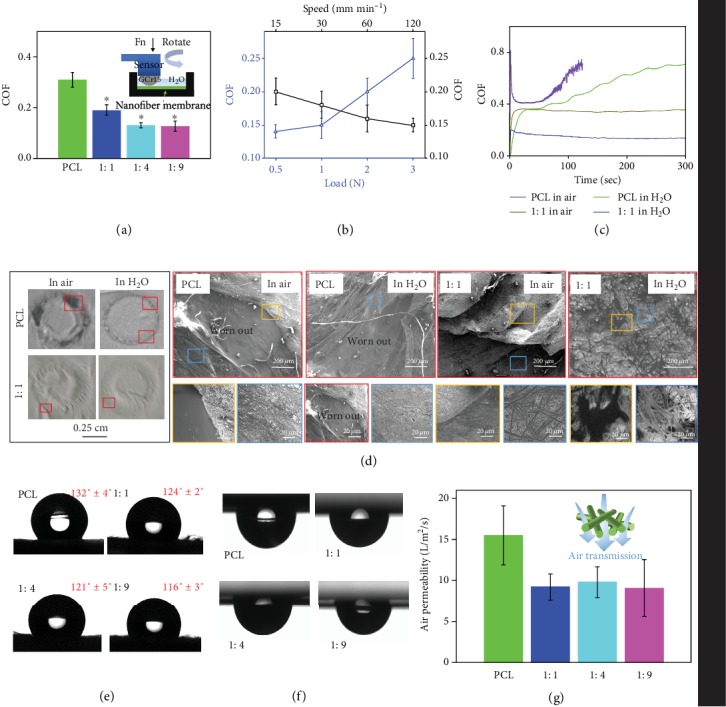
Figure 3.

Lubrication tests for the different nanofibrous samples. (a) COF of all the samples. Inset is the schematic diagram of the rotation mode. (b) COF under different normal loads and rotation speeds. (c) Time-COF curves for PCL and 1 : 1 membranes tested in air and in water. (d) Photos and SEM images of wear conditions after being tested in air and in water for PCL and 1 : 1 membranes. The magnified SEM images with different color borders are corresponding to sites with different colors. (e) Water contact angles of all the membrane samples. (f) Water droplets were vertically inverted and adsorbed on the sample surfaces. (g) Air permeability of all the fibrous samples.
