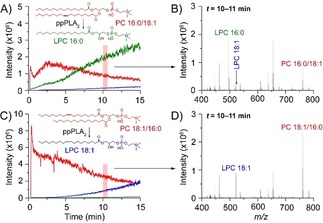
Figure 1.

Mass‐spectrometry‐based enzyme assays are sensitive and powerful. Activity assay of porcine pancreatic PLA2 on phosphatidylcholine 34:1 isomers by nESI‐MS. A) The temporal change in abundance of the substrate (PC 16:0/18:1, red) and LPC products. B) Averaged mass spectrum from the shaded area in (A). C) Depletion of PC 18:1/16:0 (red), and formation of LPCs. Averaging over the shaded area yields the mass spectrum shown in (D).
