
Fig. 4.
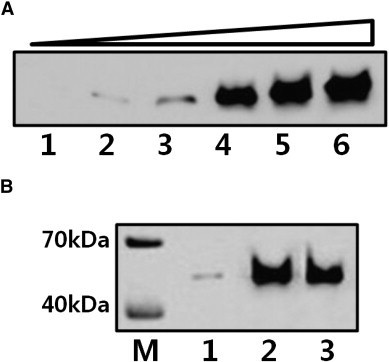
Western blot analysis with ssDNA aptamer, His-probe HRP, and anti-N protein. (A) Western blot analysis using aptamer 1. Various amounts of N protein were separated by SDS-PAGE and incubated with 5′-biotinylated aptamer 1 followed by streptavidin-HRP. The bands were visualized using the ECL reaction. Lane 1, 0 μg; lane 2, 0.92 μg; lane 3, 1.84 μg; lane 4, 4.6 μg; lane 5, 9.2 μg; and lane 6, 18.4 μg N protein. (B) Western blot analysis was performed to compare the efficacy of the His-probe HRP, anti-N protein, and aptamer 1. 9.2 μg of N protein was separated by SDS-PAGE and incubated with His-probe HRP (lane 1), anti-N protein (lane 2), and 5′-biotinylated aptamer 1 (lane 3), respectively. Lane M is the molecular weight marker. The method used for band visualization was described in Materials and methods.