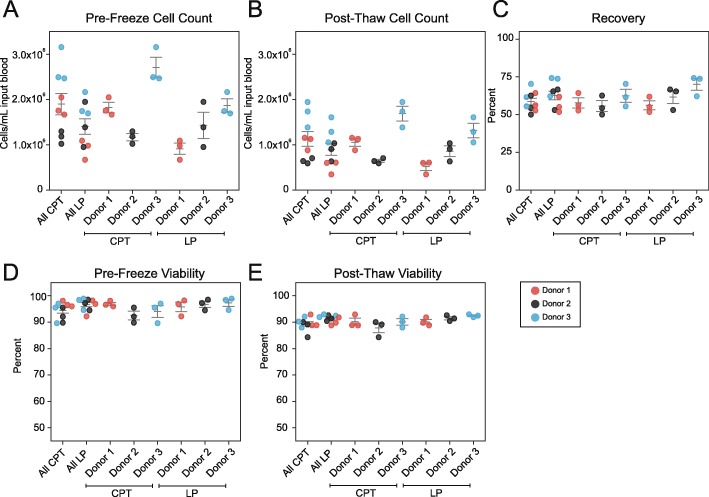
Fig. 2.
Equivalent PBMC yield and post-thaw recovery using CPT or LP Tubes. a-e Three healthy donor blood draws of six tubes each were split between three operators for parallel PBMC isolation using CPT and LP Tube methods. Total PBMCs were counted and assessed for viability by acridine iodine and propidium iodide staining using a Cellometer K2 immediately after isolation (pre-freeze), and by near-IR viability staining using a BD LSRII flow cytometer after cryopreservation and recovery (post-thaw). a The yield of PBMCs per mL of input blood pre-freeze. b The yield of PBMCs per mL of input blood post-thaw. c Percent of cell recovery post-thaw. d Cell viability pre-freeze. e Cell viability post-thaw. Horizontal lines indicate mean +/− SEM. Donors 1,2, 3 are depicted by red, black, and blue dots respectively. Three dots are shown per donor which represent single samples processed by three different operators. For statistical analysis for all figures see Table 1

