Fig. 5.
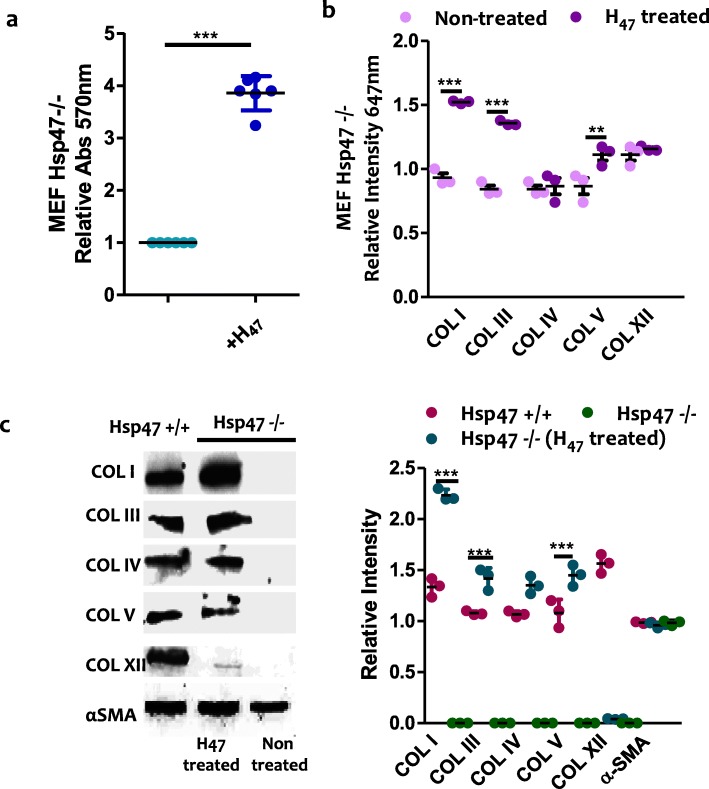
a. Quantification of fibrillar collagen deposited in MEF Hsp47−/− and Hsp47 +/+cells (control) at 24 h after H47 treatment (0.5 μM) using Sirius Red assay. b. Quantification of deposited COL I, III, IV, V and XII from immuno staining assays in MEF Hsp47−/− cultures. Error bars representing standard deviation from n-3 experiments in a and c, The plots in both a and c assays were normalized by MEF Hsp47−/− cells untreated condition taken as 1. Statistical significance in a and c was analyzed by Tukey test. Significance was calculated by comparing non treated against Hsp47 treated cells (mean ± SD, ANOVA, *** p < 0.001). c. Western blot of COL I, III, IV, V and XII in deposited collagen from MEF Hsp47 +/+, Hsp47 −/− and Hsp47−/− cultures 24 h after treatment with 0.5 μM H47. Equal amount of cells were analyzed. Black bands indicate signal from collagen subtypes specific antibody. The wiskers plot indicates relative gel bands intensity of different collagen types in MEF Hsp47 +/+, Hsp47 −/− and Hsp47−/− H47 treated conditions. Error bar indicates standard deviation from n-3 experiments. Statistical significance was analyzed by Tukey test. Significance was calculated by comparing non treated Hsp47 −/− against Hsp47 treated cells (mean ± SD, ANOVA, *** p < 0.001)

