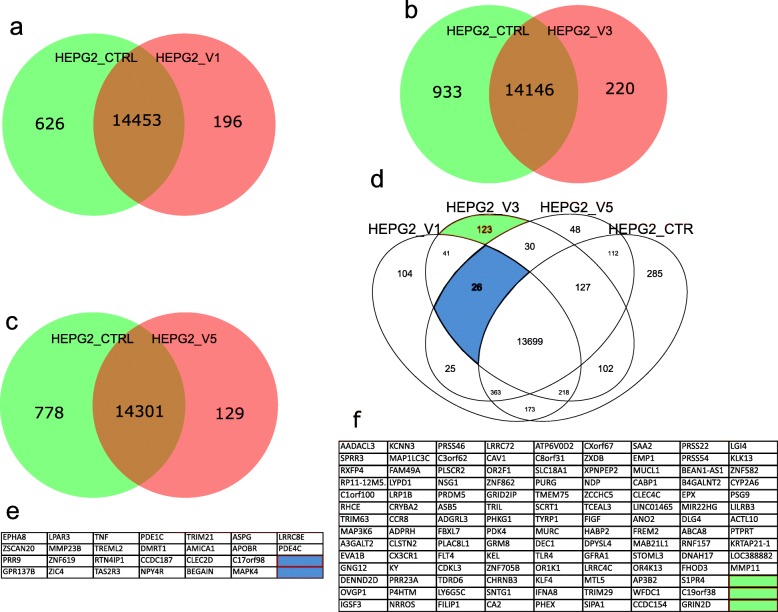
Fig. 7.
Comparison of the number of HepG2 genes that were commonly expressed or uniquely expressed for each treatment condition and the untreated cells. a Comparison of V1-treated HepG2 cells and untreated HepG2 cells. b Comparison of V3-treated HepG2 and untreated HepG2 cells. c Comparison of V5-treated HepG2 cells and untreated HepG2 cells. d Four-way comparison of the number of HepG2 genes expressed in all three treatment conditions and the untreated cells. The segment marked blue represent the common gene expression signature for the treated and untreated HepG2 cells. Expressed genes were detected using a detection p value threshold of p < 0.05. e 26 genes related to the blue segment in (d) of expression in all treatments but not in control. f 123 genes expressed exclusively in V3 related to the green segment in (d)

