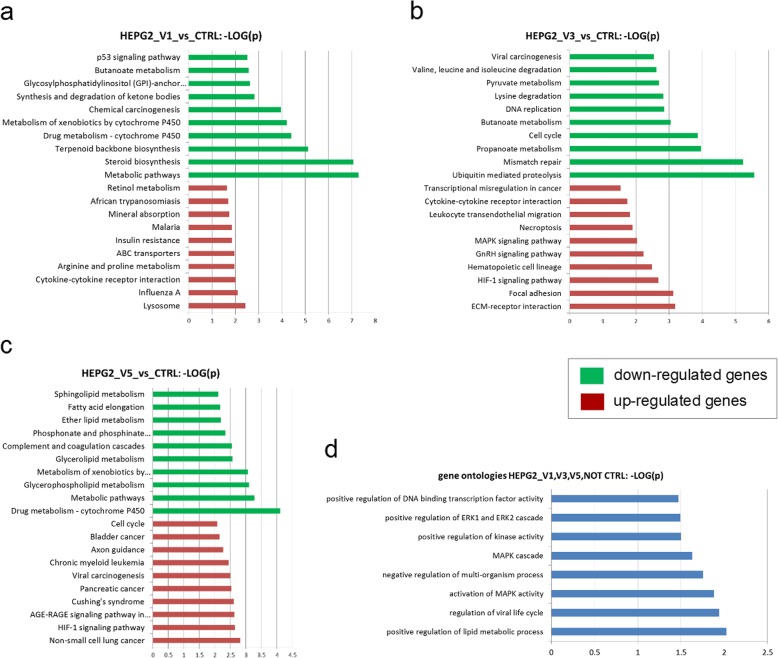
Fig. 8.
KEGG pathways affected by treatment of HepG2 cells with partially purified fractions from MEF 134 extract. a Cellular pathways up-regulated or down-regulated in V1-treated cells relative to the untreated cells. b Cellular pathways upregulated or down-regulated in V3-treated cells relative to the untreated cells. c Cellular pathways upregulated or down-regulated in V5-treated cells relative to the untreated cells. In (a-c), green and red bars indicate overrepresentation of down-regulated and up-regulated genes, respectively. d Gene ontologies for the genes commonly expressed in all three treatment conditions. In (a-d), the bar charts show the negative logarithm (base 10) of the p-value; higher values correspond to higher significance. Overrepresentation of KEGG pathways and gene ontologies were analyzed using the hypergeometric test

