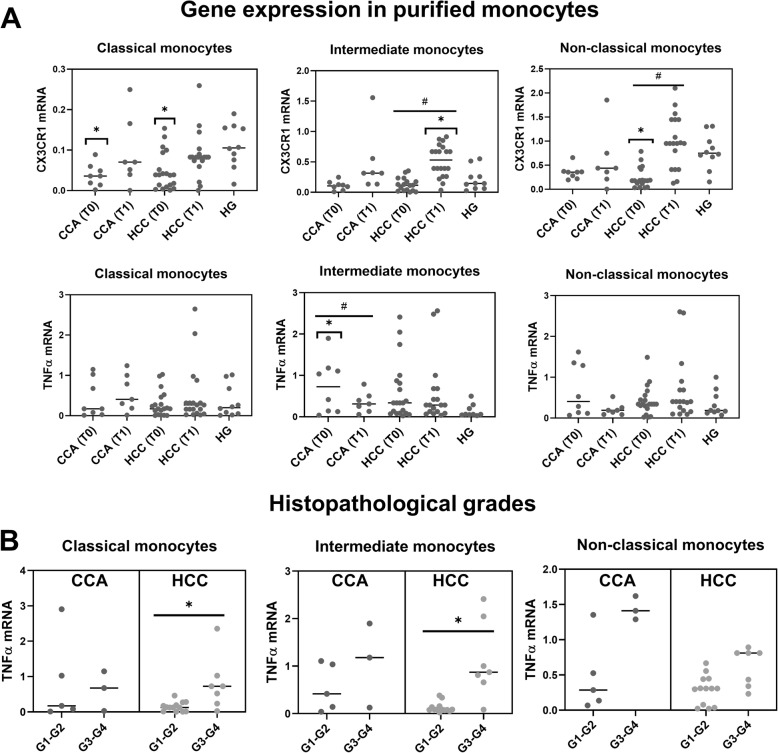
Fig. 2.
Gene expression in purified classical, intermediate and non-classical monocyte subsets. a Dot plots with the mRNA expression levels of CX3CR1 and TNFα in classical, intermediate and non-classical monocytes purified from CCA (N = 8) and HCC (N = 20) patients, at T0 and T1, and from the HG (N = 10). Statistically significant differences were considered when p < 0.05; * between the groups indicated in the figure and the HG; # between T0 and T1. b Dot plots with the mRNA expression levels of TNFα in classical, intermediate and non-classical monocytes purified from CCA and HCC patients, at T0, comparing G1-G2 versus G3-G4 tumor histopathological grades. Statistically significant differences were considered when p < 0.05; * between the groups indicated in the figure

