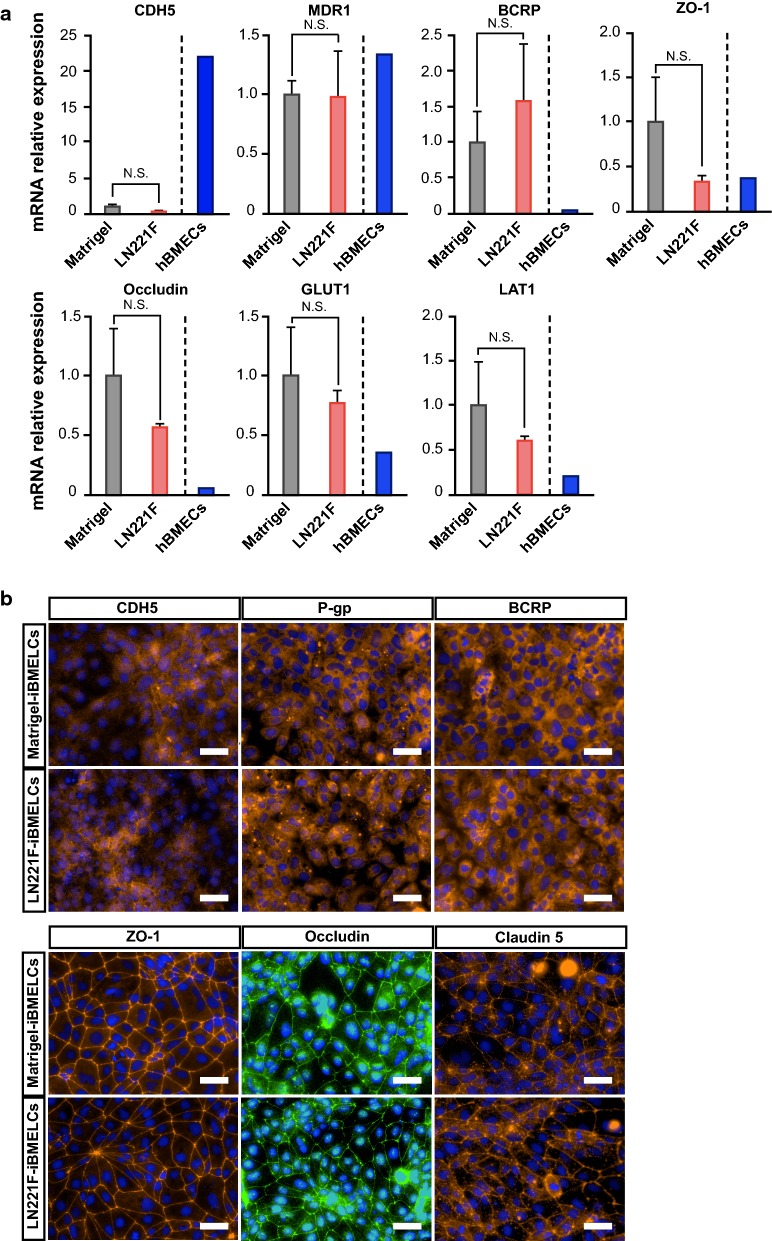
Fig. 3.
Characterization of LN221F- and Matrigel-iBMELCs. a Relative mRNA expression levels of CDH5, MDR1, BCRP, ZO-1, occludin, GLUT1, and LAT1 in LN221F- and Matrigel-iBMELCs derived from 610B1 on day 10. The values are normalized to those of HPRT1. The relative mRNA expression levels of Matrigel-iBMELCs were defined as 1. Data are presented as the mean ± SD (n = 3; N.S. = not significant; Student’s t-test). hBMECs: n = 1. b Immunofluorescence analysis of CDH5 (orange), P-gp (orange), BCRP (orange), ZO-1 (orange), occludin (green), and claudin 5 (orange) expression in LN221F- and Matrigel-iBMELCs derived from 610B1 on day 10. DAPI = blue. Scale bars = 50 μm

