Fig. 2.
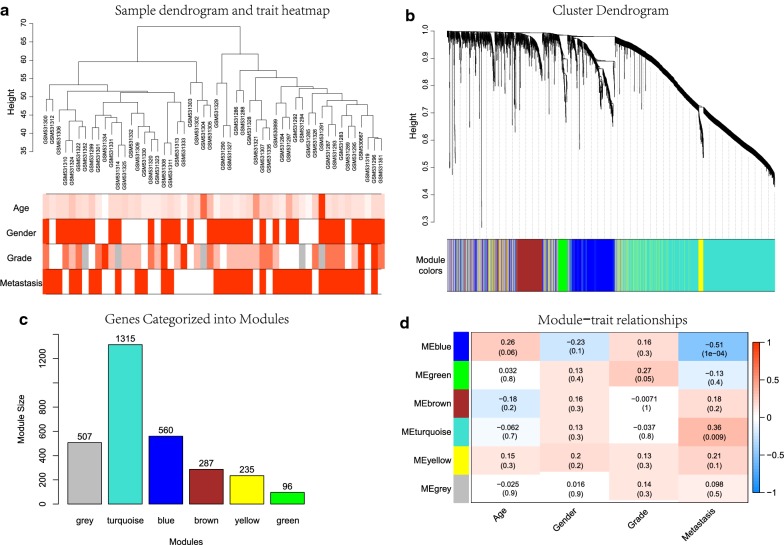
Construction and identification of modules associated with the clinical traits. a Clustering dendrogram of OS samples and the clinical traits. For age and grade, white means a low value, red a high value, and grey a missing entry; for gender and metastasis, white means female or non-metastasis, red means male or metastasis. b Hierarchical clustering based on the dynamic tree, each branch above represented a gene, and each color below represented a gene co-expression module. Grey module color is a reserved one for genes that are not part of any module. c Number of genes in different gene co-expression modules. Note that genes in the grey module were identified as not co-expressed. d Heatmap of the correlation between module eigengenes and clinical traits. Each row corresponds to a module eigengene, column to a trait. Each cell contains the corresponding correlation and p-value. The table is color-coded by correlation according to the color legend. The blue module was significantly correlated with metastasis

