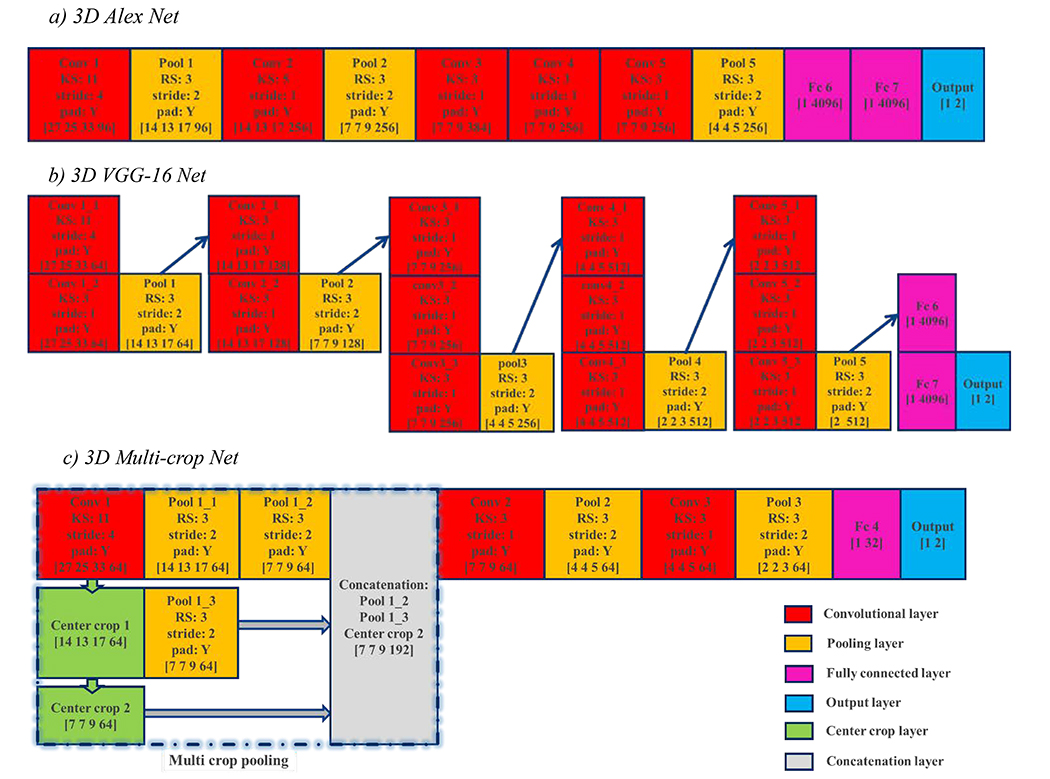
Fig. 3.
Three 3D CNN architectures modified from two widely used 2D architectures and one 3D CNN dedicated to lung nodule malignancy classification. The vector at bottom of each rectangle indicates the size of the output tensor at this layer for a patient case, with the last number being the unit number. The workflow is from top to bottom and left to right on adjacent rectangles, and along the arrow direction on non-adjacent rectangles. KS: kernel size; RS: region size.

