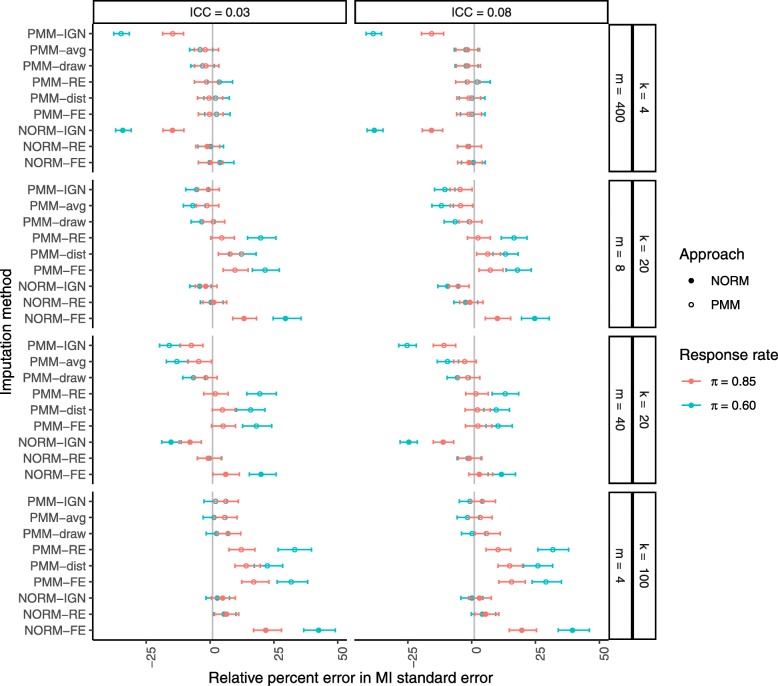
Fig. 1.
Relative percent error in the MI standard error of the treatment group mean after MI with a correctly specified imputation model. Missing data were generated completely at random (MCAR) at a rate of 15% or 40% (π=0.85 in red or π=0.60 in green, respectively). From top to bottom, results are presented in increasing order of cluster sizes m within an increasing order of number of clusters k. From left to right, results are presented in increasing order of the intracluster correlation coefficient (ICC, ρ). Filled circles indicate PMM methods while open circles indicate parametric (NORM) methods

