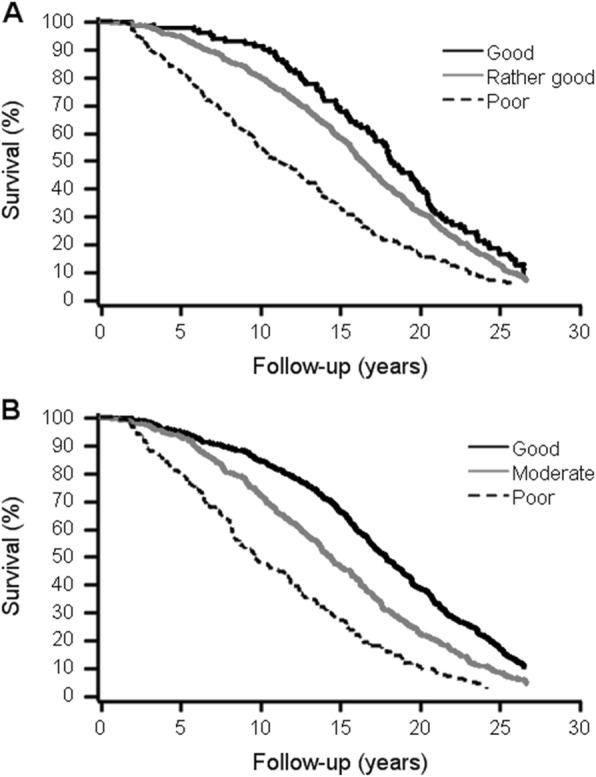
Fig. 1.

Kaplan-Meier survival curves by self-rated health (a) and objective health status (b). Number of participants alive at 0-, 5-, 10-, 15-, 20- and 25-year follow-ups by. a Self-rated health categories. Good: 451, 429, 381, 299, 175 and 76. Moderate: 363, 338, 262, 170, 81 and 30. Poor: 148, 119, 71, 40, 15 and 4. b Objective health status categories. Good: 103, 101, 94, 70, 41 and 17. Rather good: 644, 611, 515, 376, 203 and 81. Poor: 261, 213, 141, 86, 41 and 17
